Wrangling Canada's corporate networks
Greetings patrons,
It’s time for another research update. In this letter, I share some exciting new work that untangles Canada’s corporate ownership networks. What’s more, I invite you to beta test my interactive graphs! Let’s dive in.
Wrangling corporate ownership data
Back in 2022, my colleague DT Cochrane reached out to me with an intriguing research problem. At the time, he was working for Canadians for Tax Fairness and was studying how big corporations had profited from various COVID-related subsidies. (Read his report here.) Some of this research required pegging down ownership stakes in particular companies.
On that front, Statistics Canada publishes an expansive database on Canadian inter-corporate ownership. So with this data, you’d think it would be trivial to peg down the ownership of any given company. But actually, it’s not.
Backing up a bit, tracking ownership shares involves crawling chains of parent-subsidiary relations. If the chain is simple, calculating ownership is straightforward. For example, suppose that Company A owns 50% of Company B, which in turn, owns 60% of Company C. Such a network looks like this:
Company A (50%)→ Company B (60%) → Company C
To calculate Company A’s net ownership of Company C, we compute the product of ownership shares along the ownership chain. Here, that product is 50% × 60% = 30%. So Company A owns 30% of Company C. Easy.
The problem comes when parent-subsidiary relations grow more complex. In real-world corporate networks, there can be dozens (or even hundreds) of ownership paths between two companies. In this case, calculating cumulative ownership involves summing net ownership along every ownership path between the two companies.
Of course, computers can make short work of this summation, provided that the data is in a suitable form. Here, the best practice for organizing network data is to create a table of pairwise connections between nodes. For corporate data, that means a table in which each row lists a parent-subsidiary relation, as shown below:
| Parent | Subsidiary | Ownership |
|---|---|---|
| Company A | Company B | 50% |
| Company B | Company C | 60% |
| Company A | Company D | 20% |
Given such pairwise data, we can easily tell a computer to crawl all the ownership paths connecting any two companies. (And by ‘easily’, I mean that this task is well-known to network scientists, so there are many tools that can do the job. The NetworkX Python library is particularly good.)
Unfortunately, a big part of doing research involves wrangling data that is not formatted for computation. Usually, such awkwardness occurs because the data is intended for human visual consumption. Wide tables are a common example. When the World Bank serves time-series data for country population, the downloaded spreadsheet looks like this:
| Country | 2021 (millions) | 2022 (millions) | 2023 (millions) |
|---|---|---|---|
| China | 1,412.36 | 1,412.18 | 1,410.71 |
| India | 1,407.56 | 1,417.17 | 1,428.63 |
| United States | 332.03 | 333.29 | 334.91 |
This data is ‘wide’ in the sense that as the time scope expands, the table will sprawl horizontally. Now, the nice feature of this wide data is that it’s easy for the human eye to locate a specific data point. That said, if the goal is to do mass computation, it’s preferable to have the data in a long format, like this:
| Country | Year | Population (millions) |
|---|---|---|
| China | 2021 | 1,412.36 |
| China | 2022 | 1,412.18 |
| China | 2023 | 1,410.71 |
| India | 2021 | 1,407.56 |
| India | 2022 | 1,417.17 |
| India | 2023 | 1,428.63 |
| United States | 2021 | 332.03 |
| United States | 2022 | 333.29 |
| United States | 2023 | 334.91 |
With this long format in hand, we have a host of computational tools that can make short work of sorting through huge chunks of data. Instead of visually parsing the data, we send logical commands to the computer. For example, to find China’s data in 2021, we’d say something like:
find: Country == 'China' & Year == 2021
Anyway, all of this is to say that in computational terms, the best way to format corporate ownership data is as a long list of pair-wise ownership connections between companies. But for its part, Statistics Canada has published its corporate ownership data in a (somewhat) more human readable tree format. Here’s a truncated example for the Thomson family network:
THE THOMSON FAMILY GROUP (0%)
└── ESTATE OF KENNETH R. THOMSON (100%)
    └── THOMSON INVESTMENTS LIMITED (75%)
        ├── SEB INVESTMENTS CORP (85%)
        ├── LCC ISSUE LIMITED (100%)
        │   └── LCC ISSUE CORP (100%)
        ├── KRT INVESTMENTS CORP. (77%)
        └── LCC INVESTMENTS CORP. (100%)
            ├── LINCHRIS INC (100%)
            │   └── 1000078931 ONTARIO LIMITED (100%)
            ├── LCC FAMILY CORP (100%)
            │   ├── 2844558 ONTARIO INC. (21%)
            │   ├── THE AUDRA GROUP INC. (50%)
            │   └── 2669789 ONTARIO LIMITED (90%)
            └── DYM INVESTMENTS CORP. (100%)
(Note: the percentages represent the ownership stake in each subsidiary by its direct parent.)
While this data format visually conveys the nested structure of ownership, it’s not very useful for computational analysis. Indeed, when DT Cochrane first described his project to me, it took me several days to realize that the data would be more useful if it was transformed into a long table of ownership pairs.
Once that work was done, I discovered that the resulting network data could be easily visualized with R. From there, Cochrane suggested mapping the ownership networks of Canada’s richest families — a project that eventually gave birth to our 2023 essay ‘Mapping the Ownership Network of Canada’s Billionaire Families’.
Since that essay was published, it’s been on my to-do list to run a more expansive analysis of the inter-corporate ownership data. This fall, I’ve finally started doing it. Which brings me to the charts below.
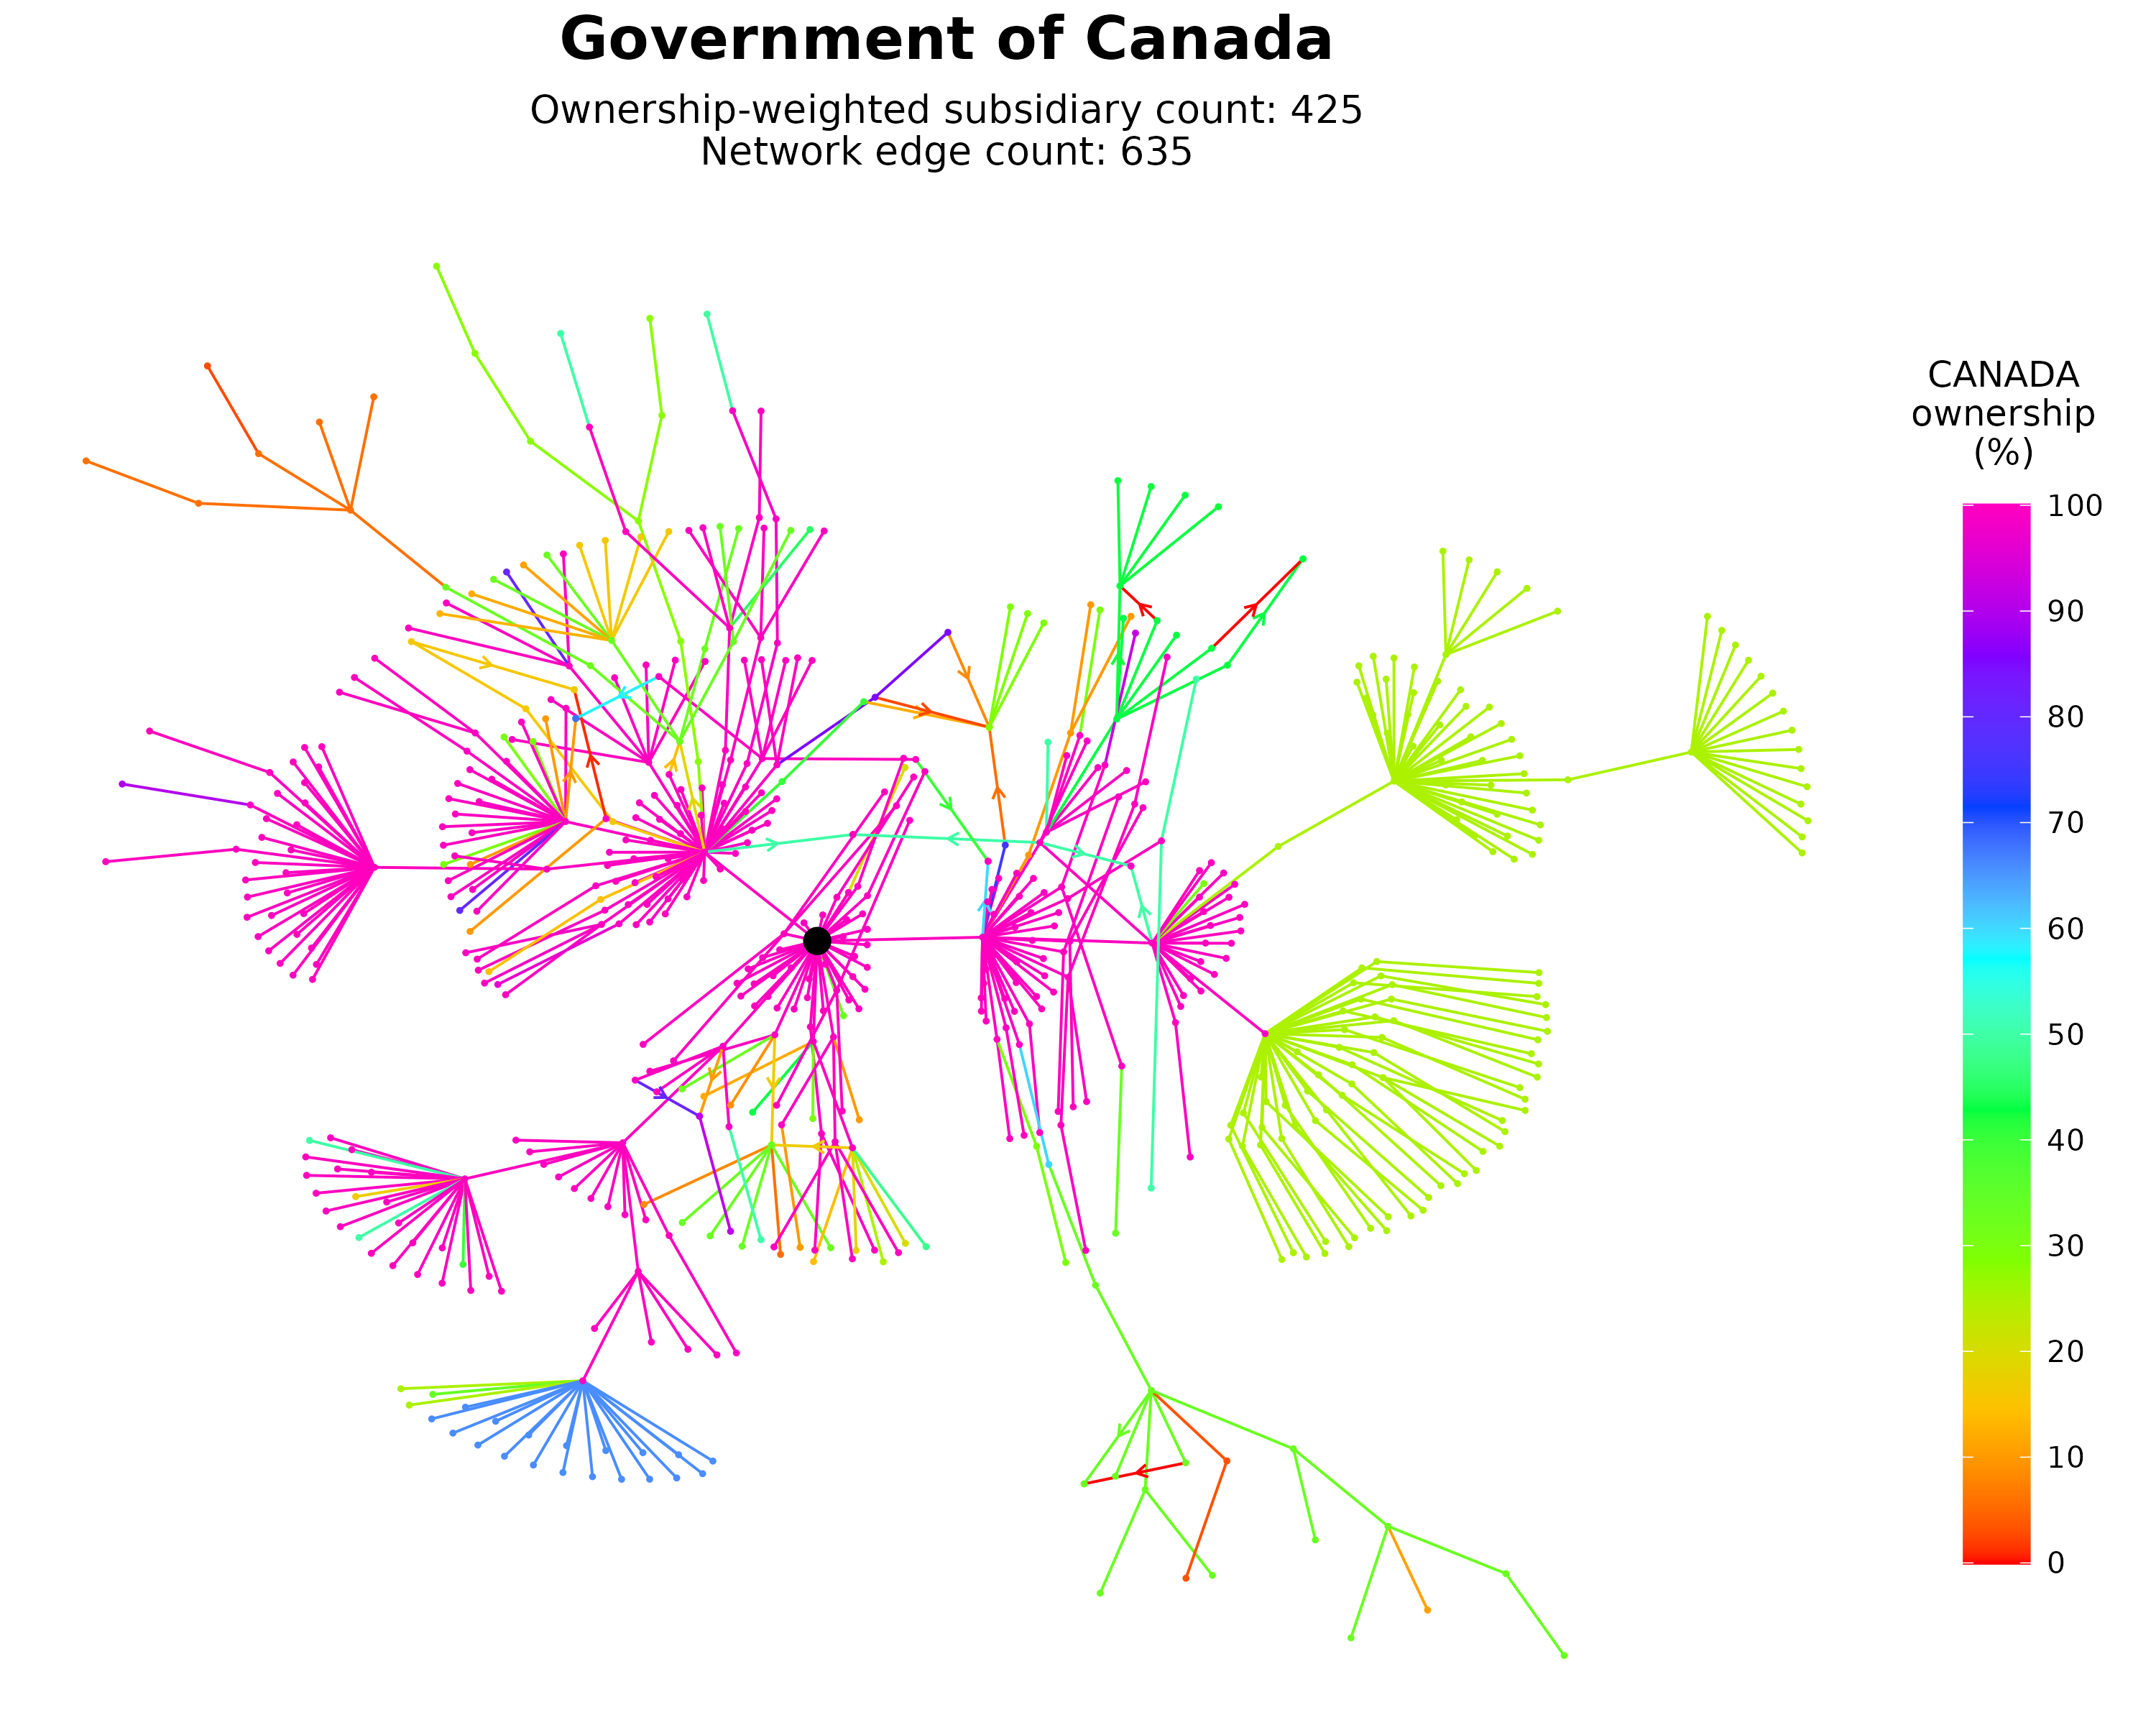
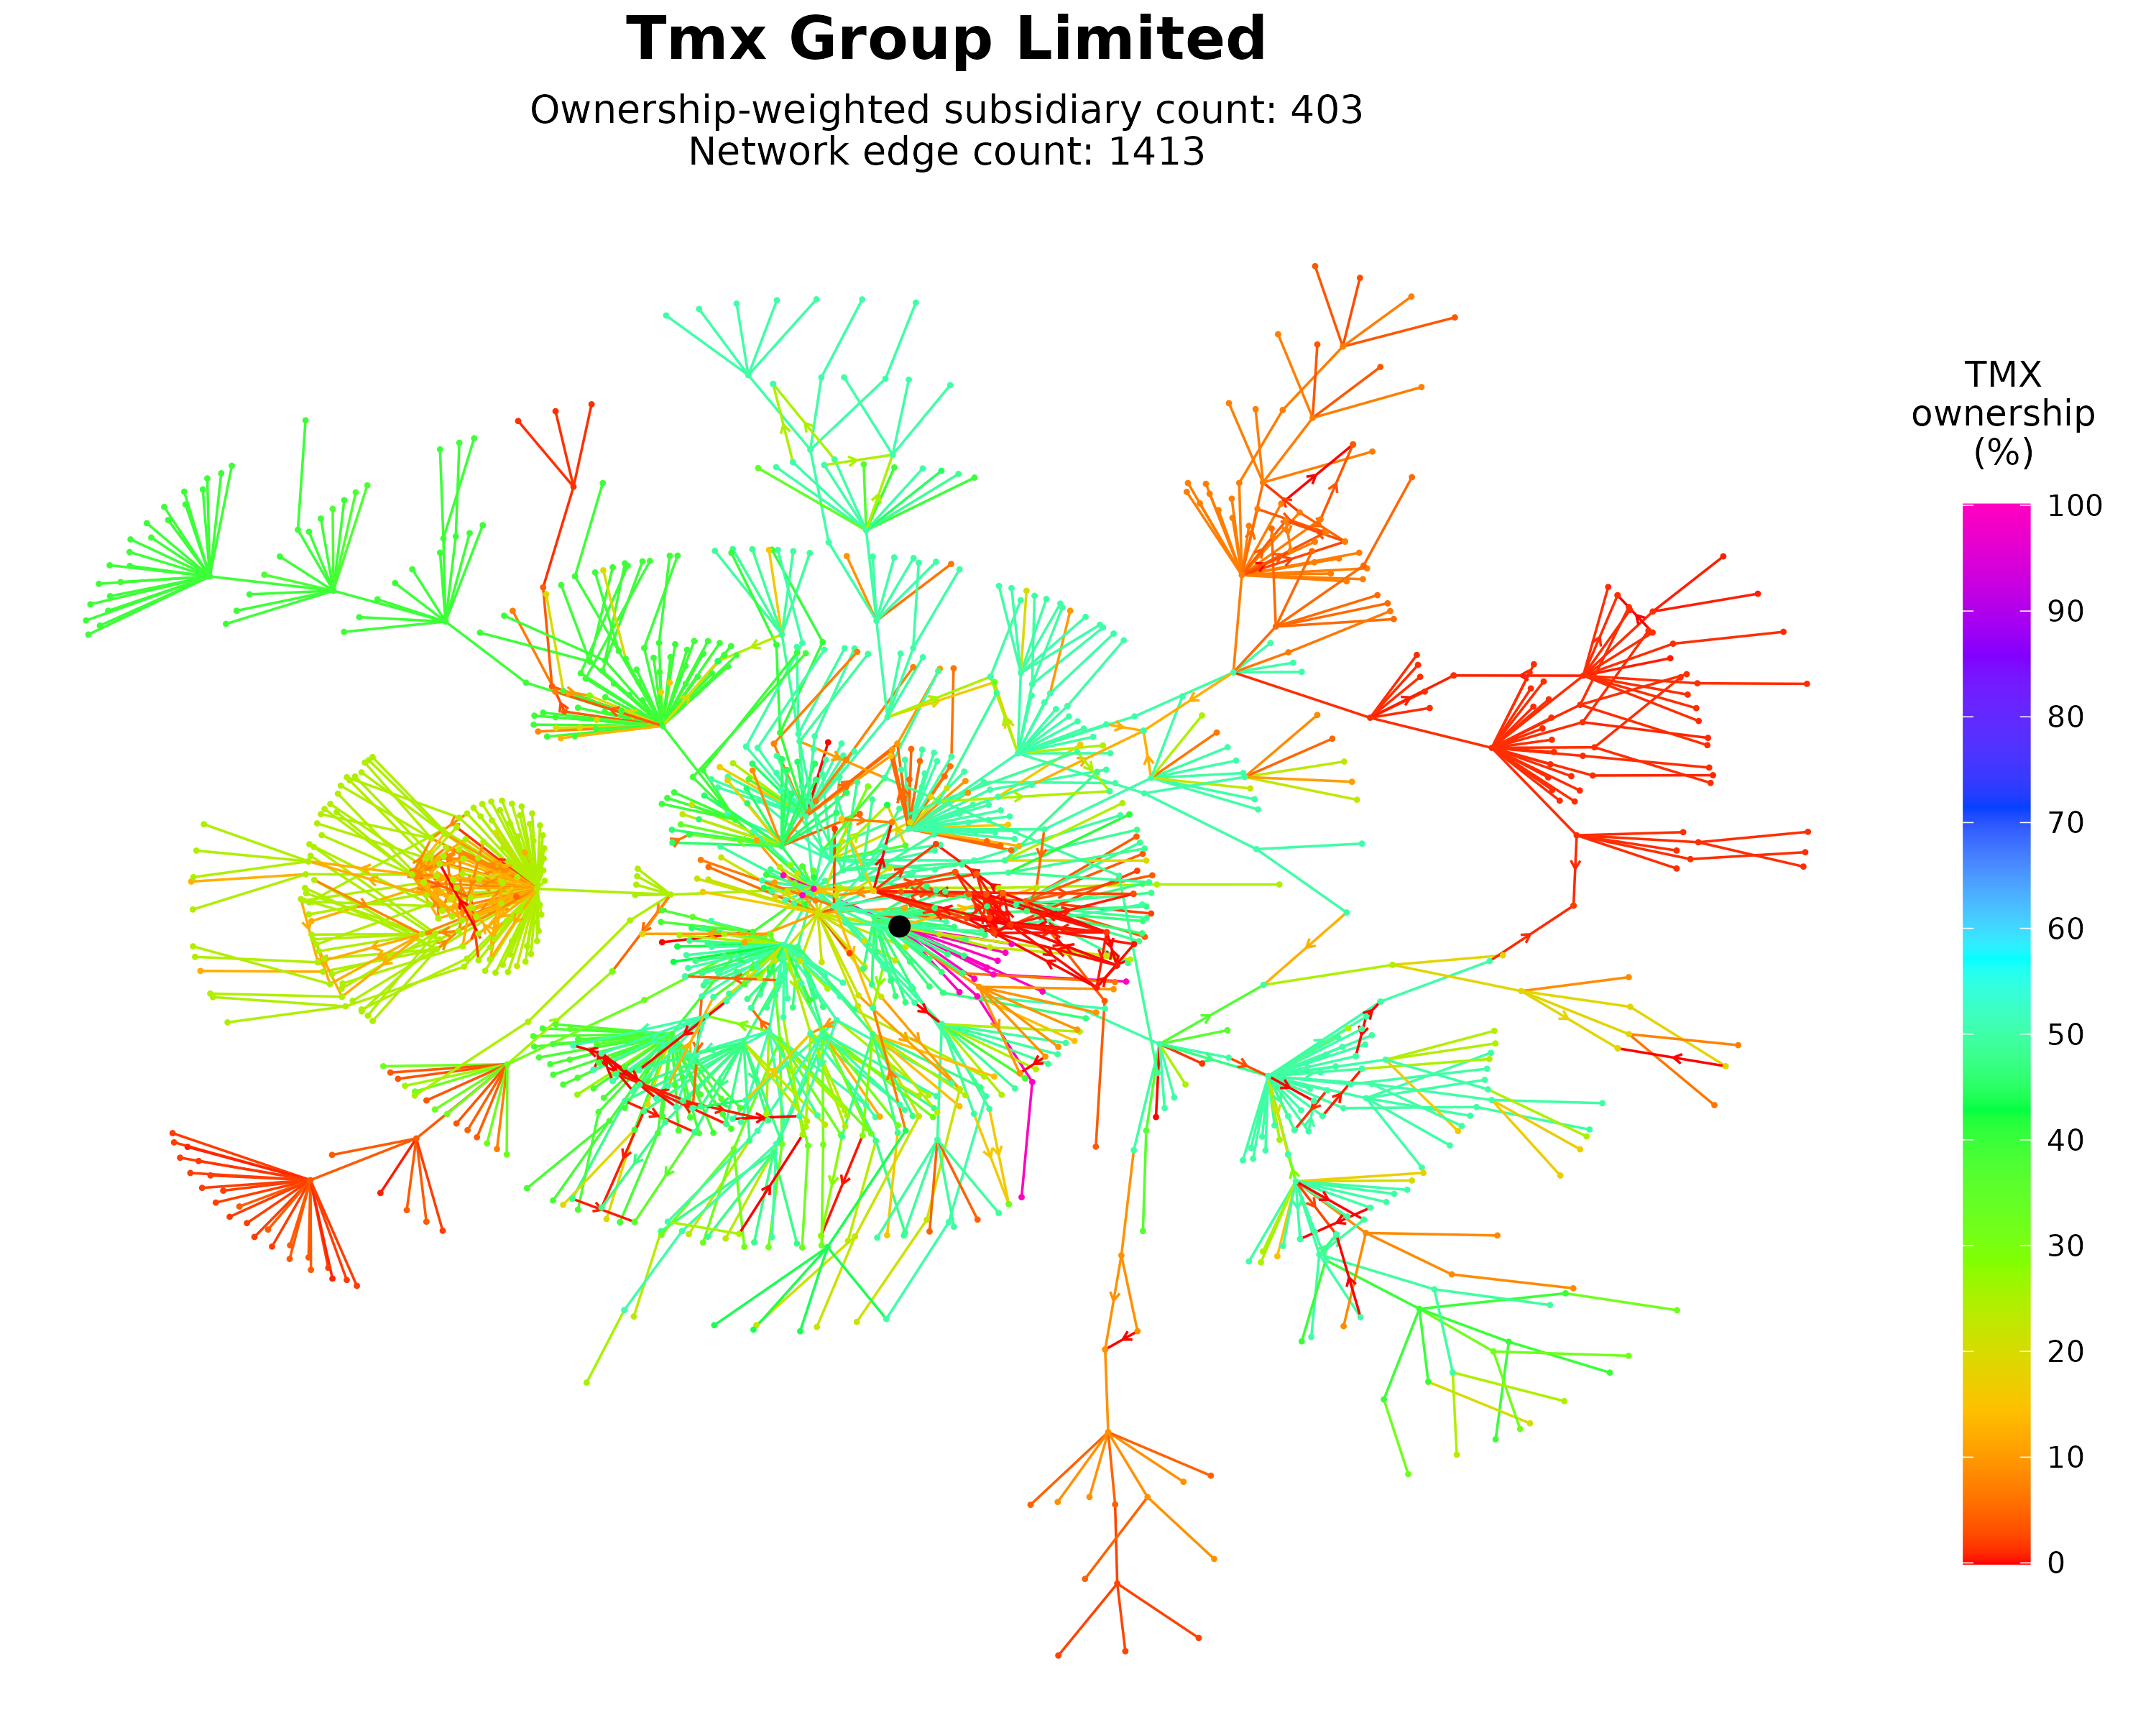
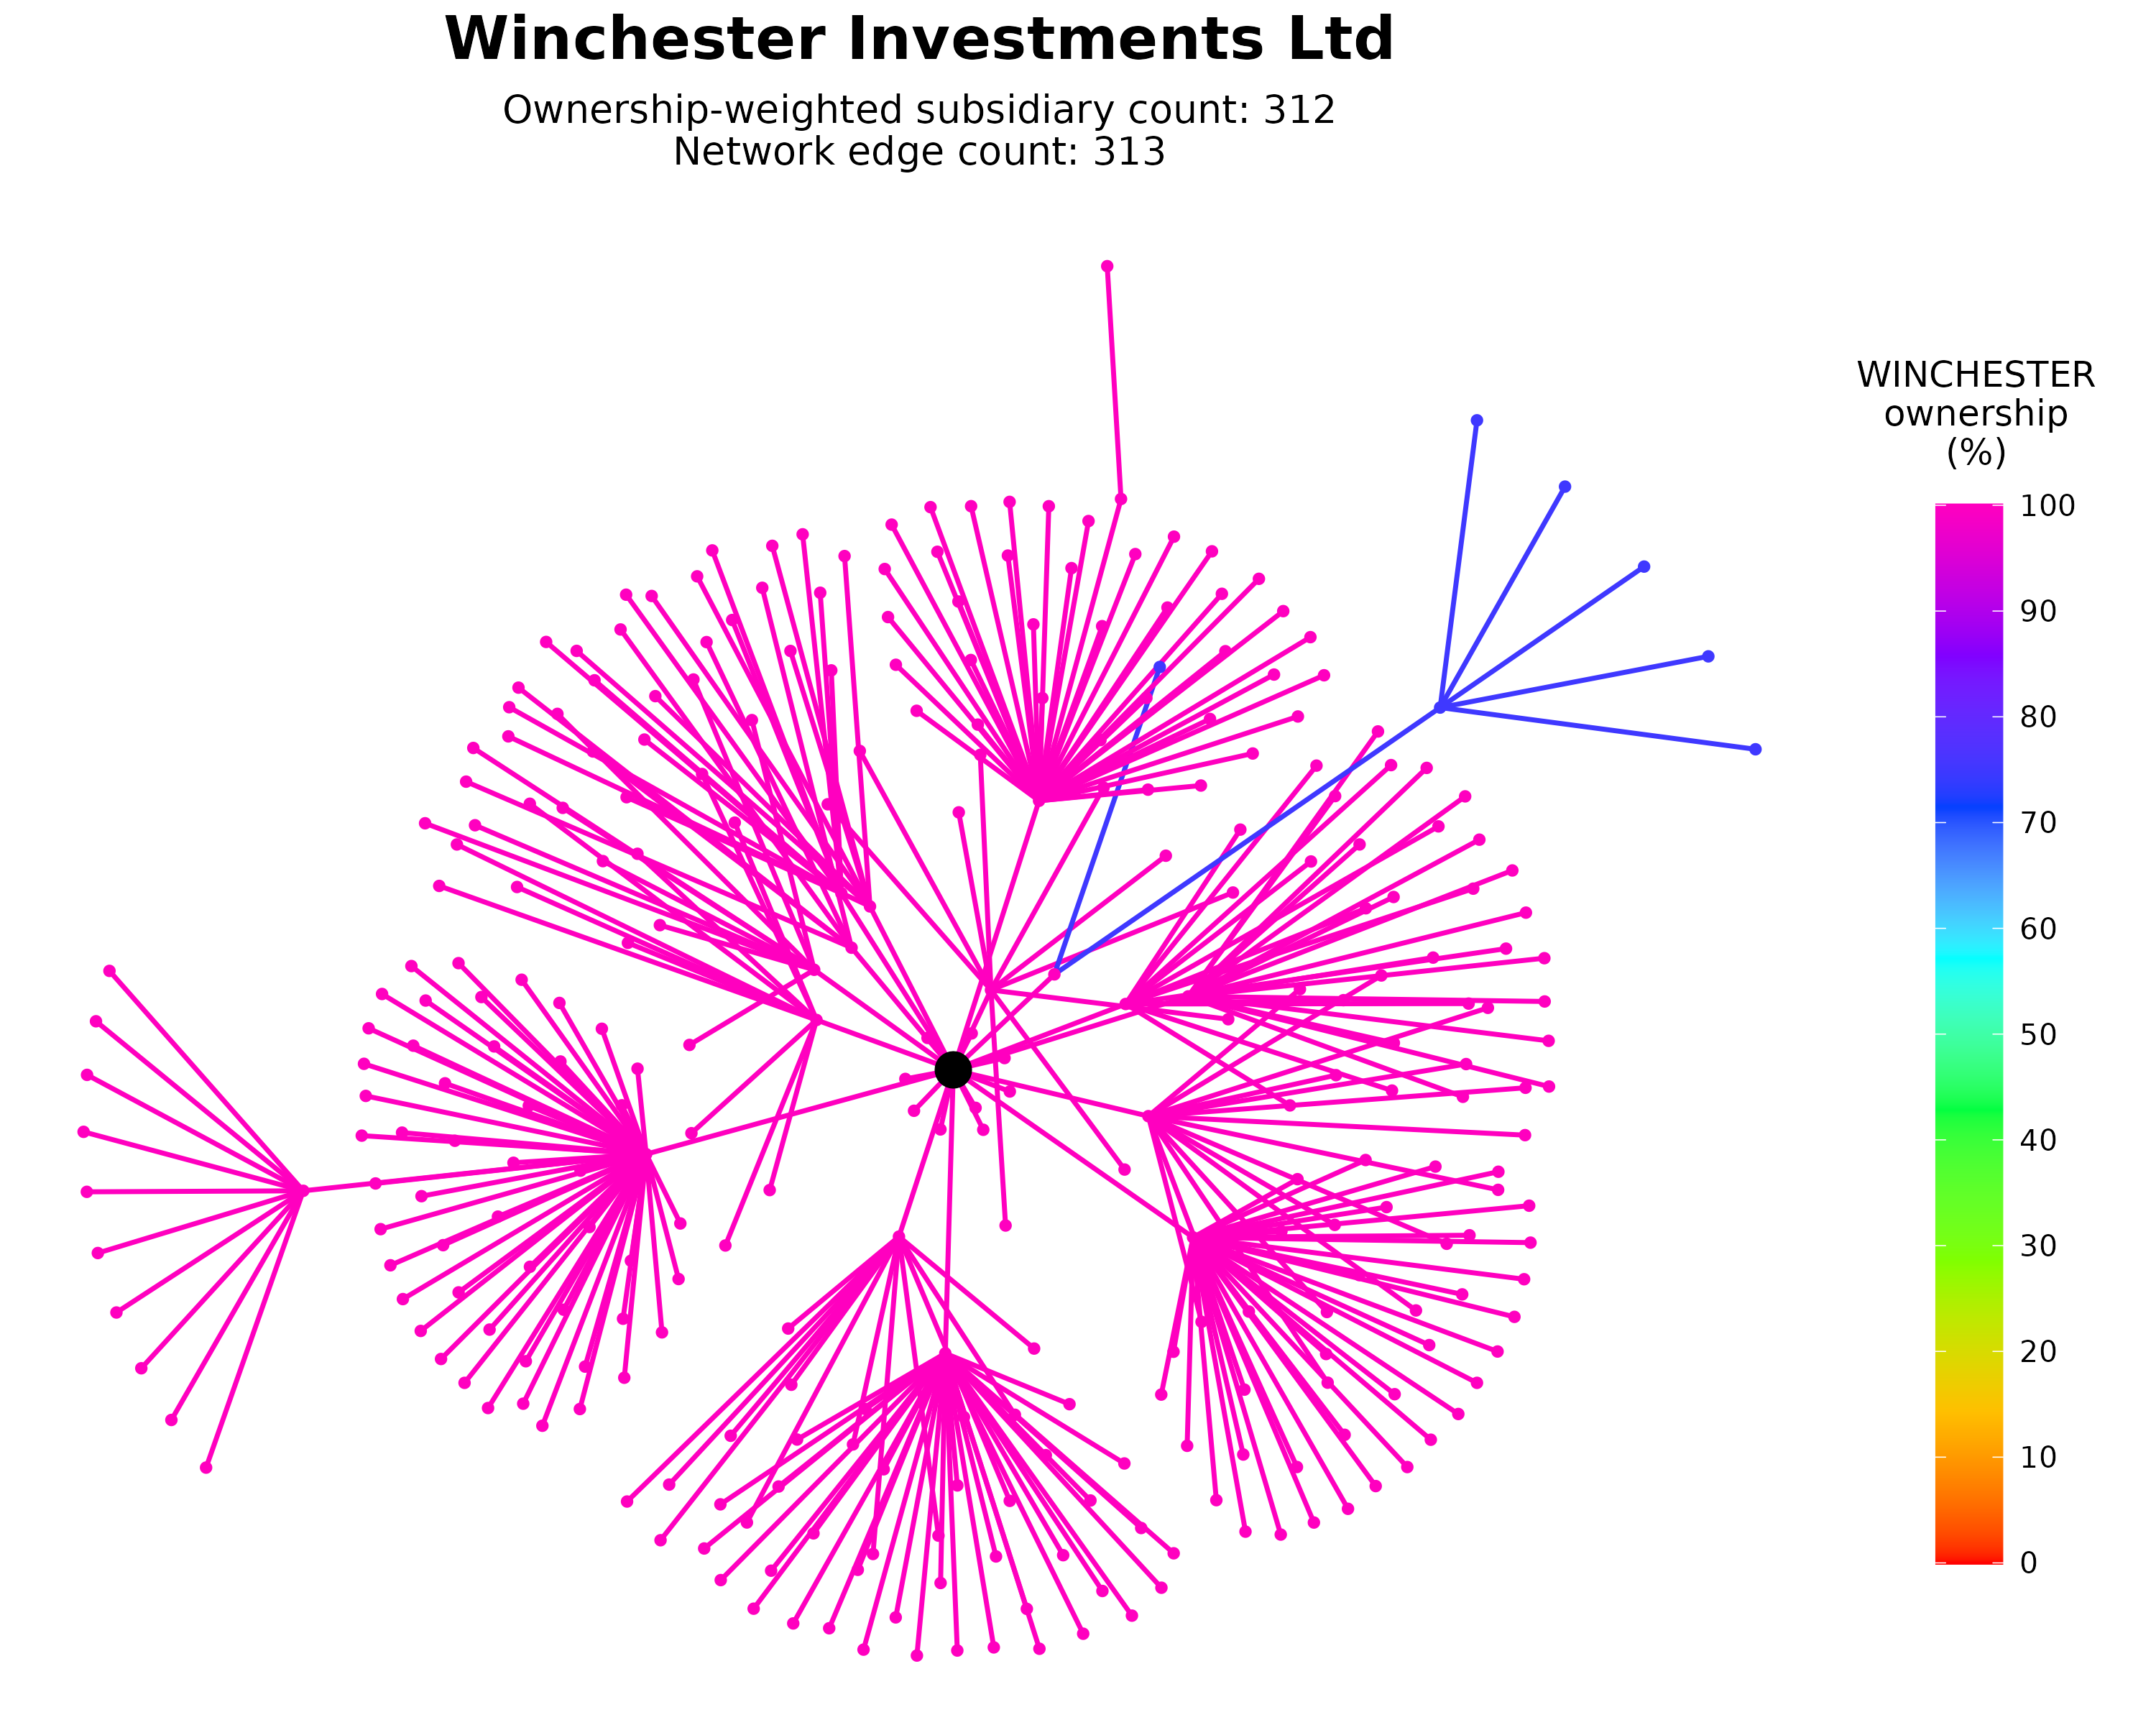
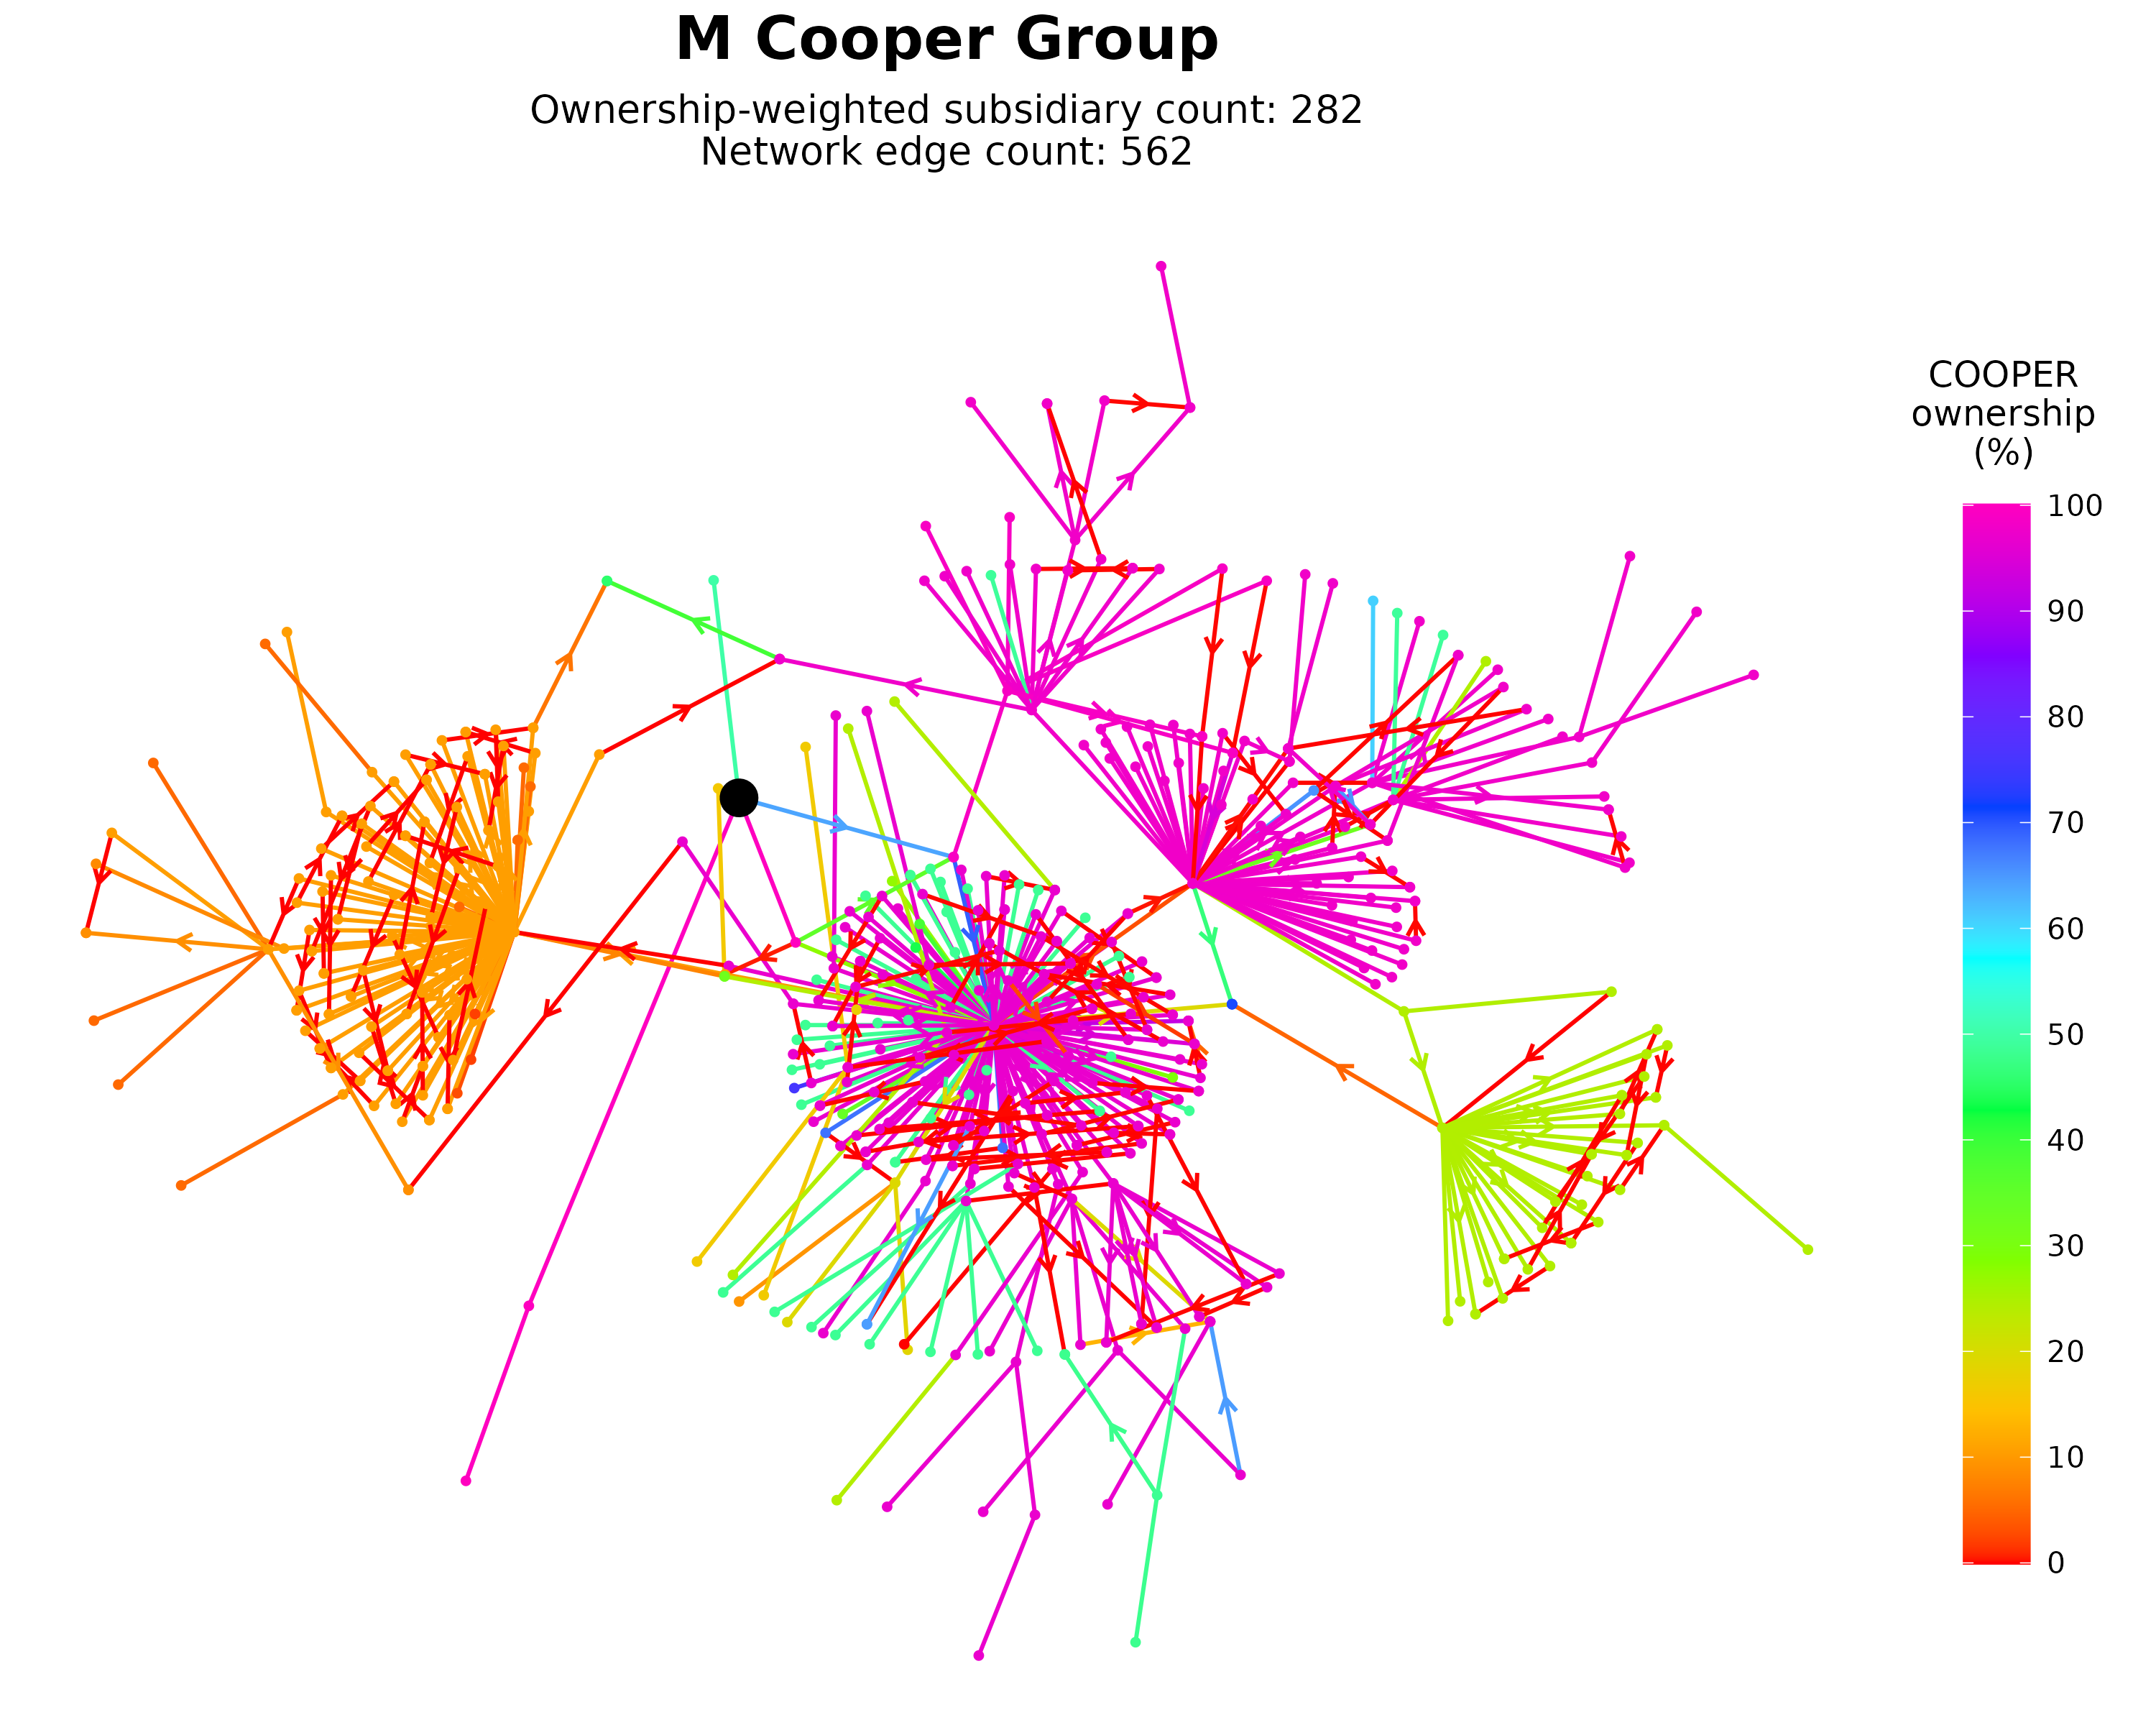
In a forthcoming post, I’m going to visual the fifty largest corporate networks in Canada. (And by ‘largest’, I mean the networks with the most subsidiaries, weighted by ownership stake.) The charts below show working versions for the top 10 networks. Here, each point is a company, and each line segment is an ownership relation. Color shows the network parent’s net ownership along each path, and of each subsidiary. Arrows show the direction of ownership, but only for connections that are unclear. In general, ownership claims flow outward from the large central node. (I tried putting arrows on every connection, but the charts became too cluttered.)
Now, these charts are cool. But what’s even cooler (in my mind) are the interactive graphs found in the links below each chart. In these interactive graphs, you can click on (or search for) individual companies and then isolate the ownership paths to them. And you can view the corresponding data in a cleanly formatted table.
If you’ve got the time, I’d be grateful if you could beta test these interactive charts. Click around and see if anything is broken or could be improved. All comments are welcome!
Looking ahead, I’ve got big plans for this data, which includes a video showing how these top 50 networks collectively merge to form the ‘backbone’ of corporate Canada. It’s been a ton of work, but the results are amazing. Heck, even my 11-year-old daughter is impressed by the visuals (although she has no idea what they mean).
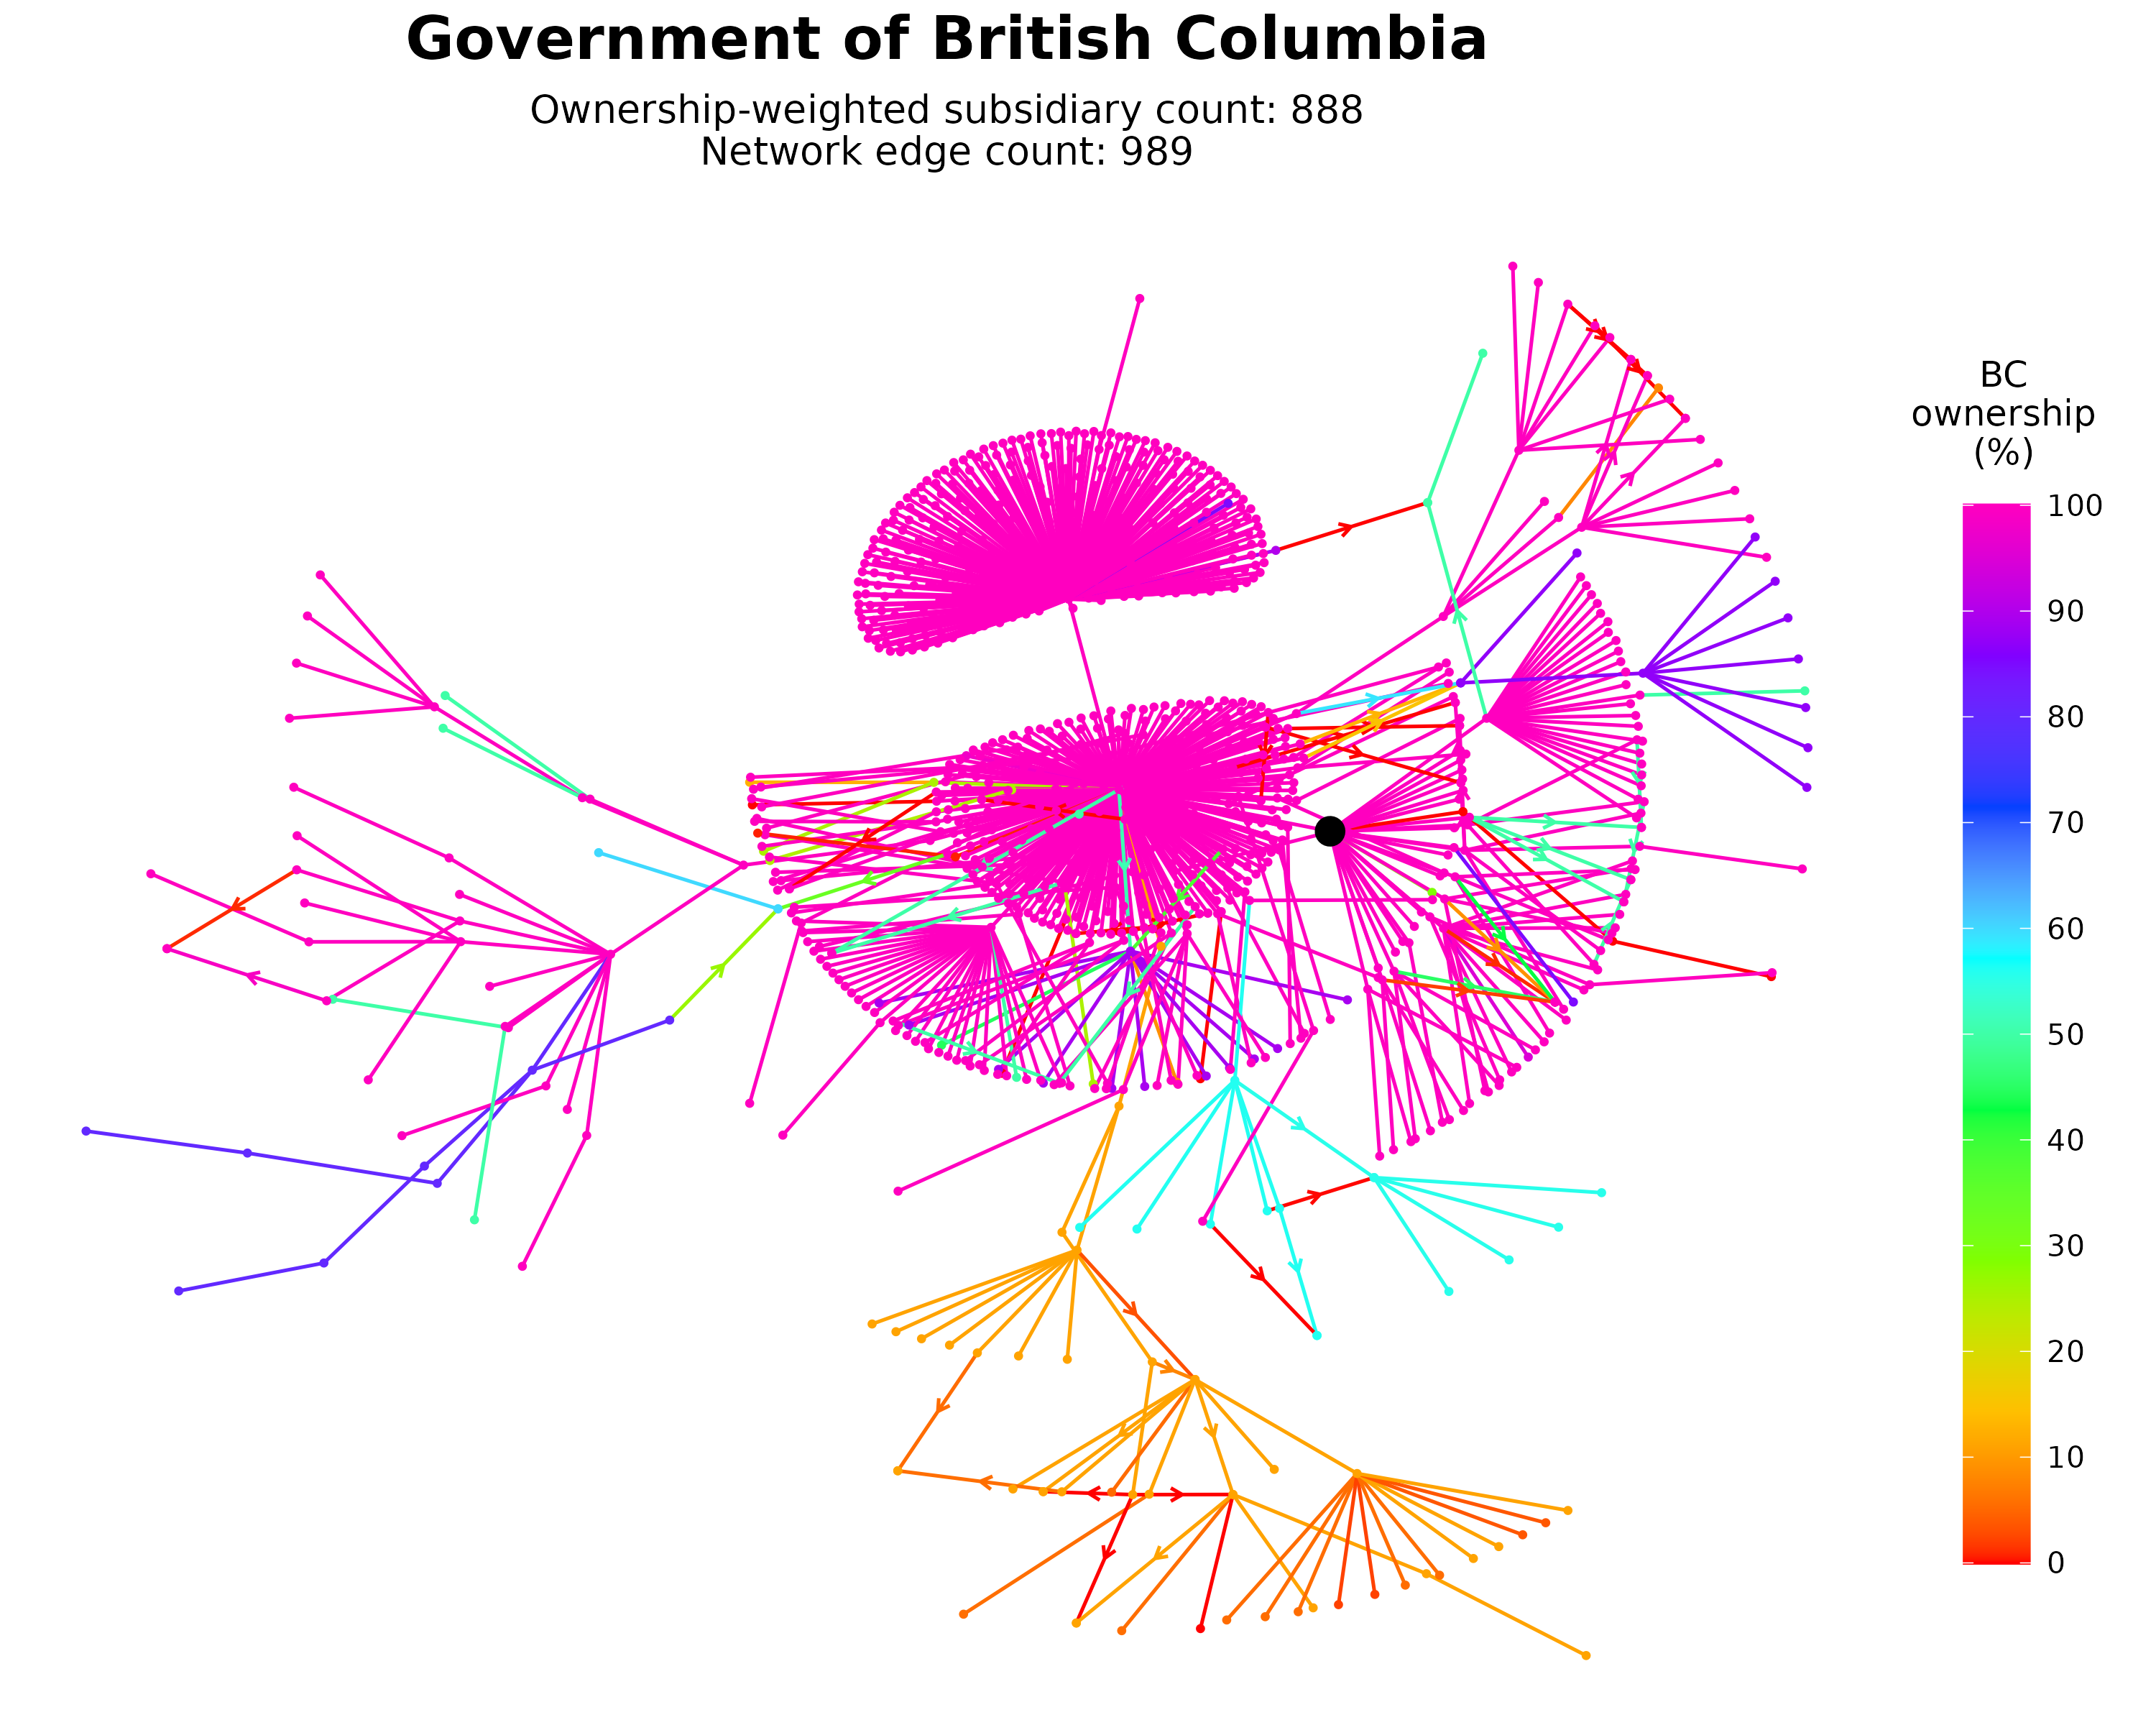
1. Government of British Columbia. Interactive chart
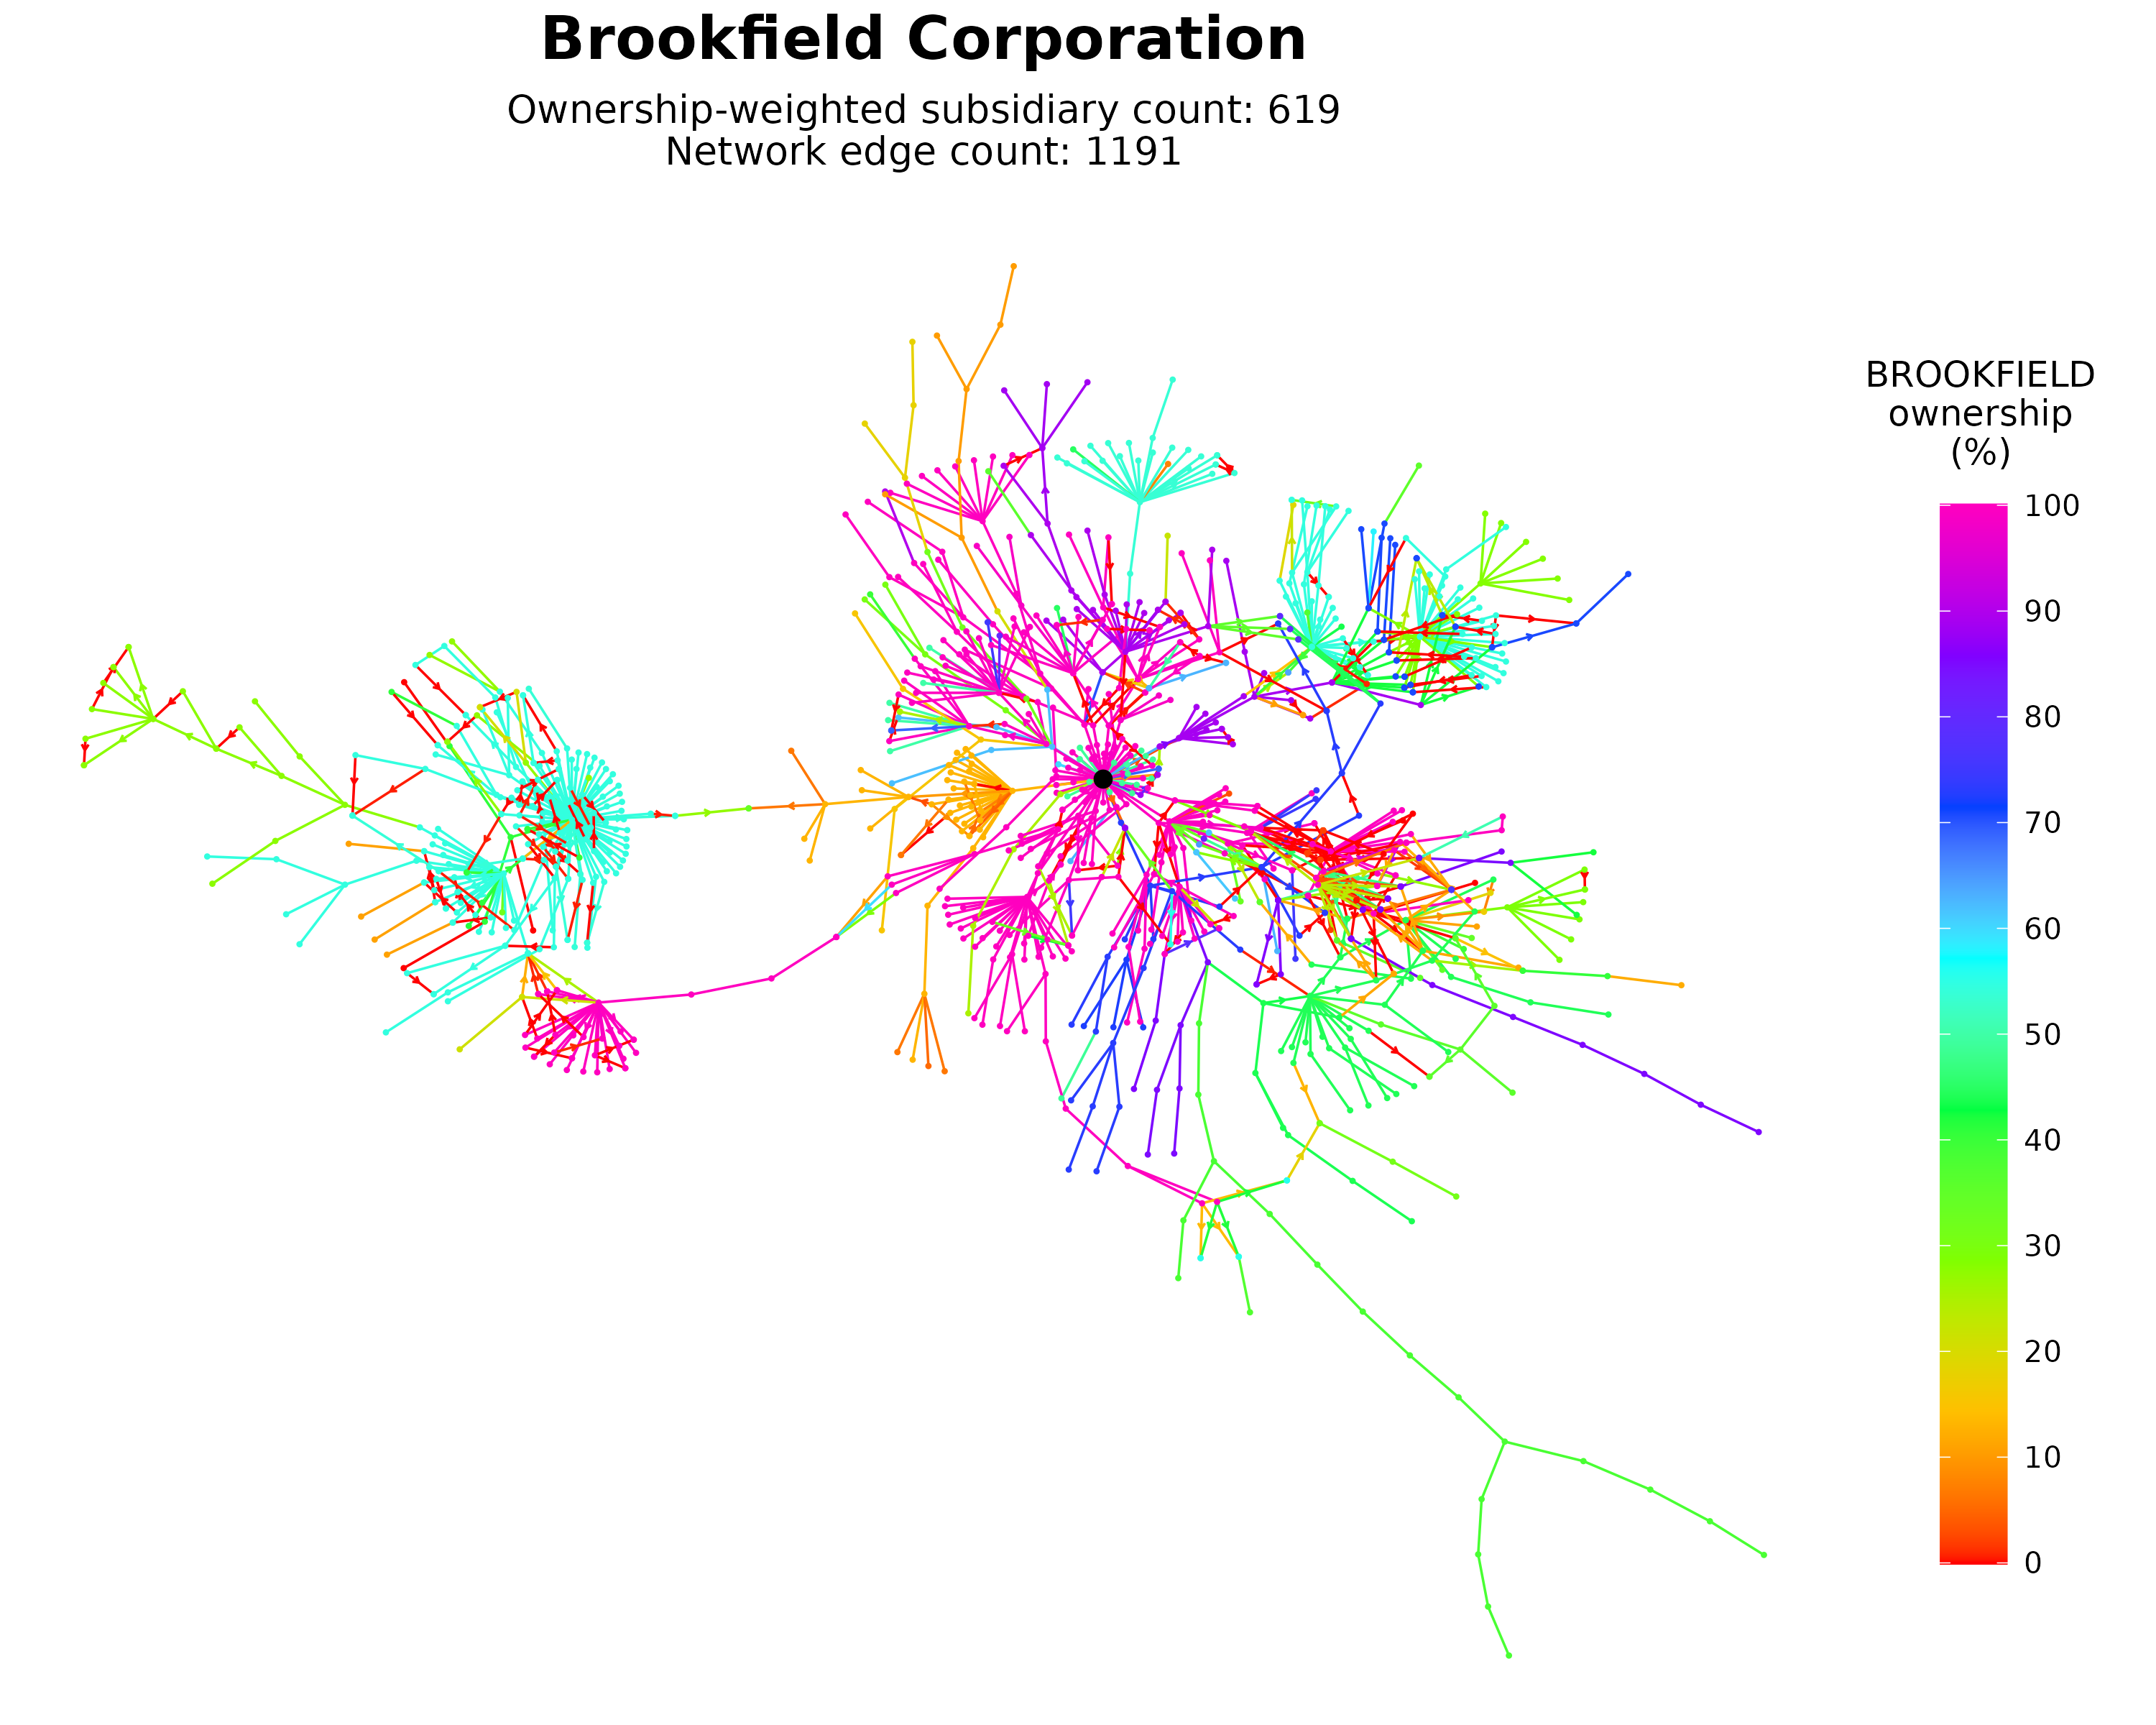
2. Brookfield Corporation. Interactive chart
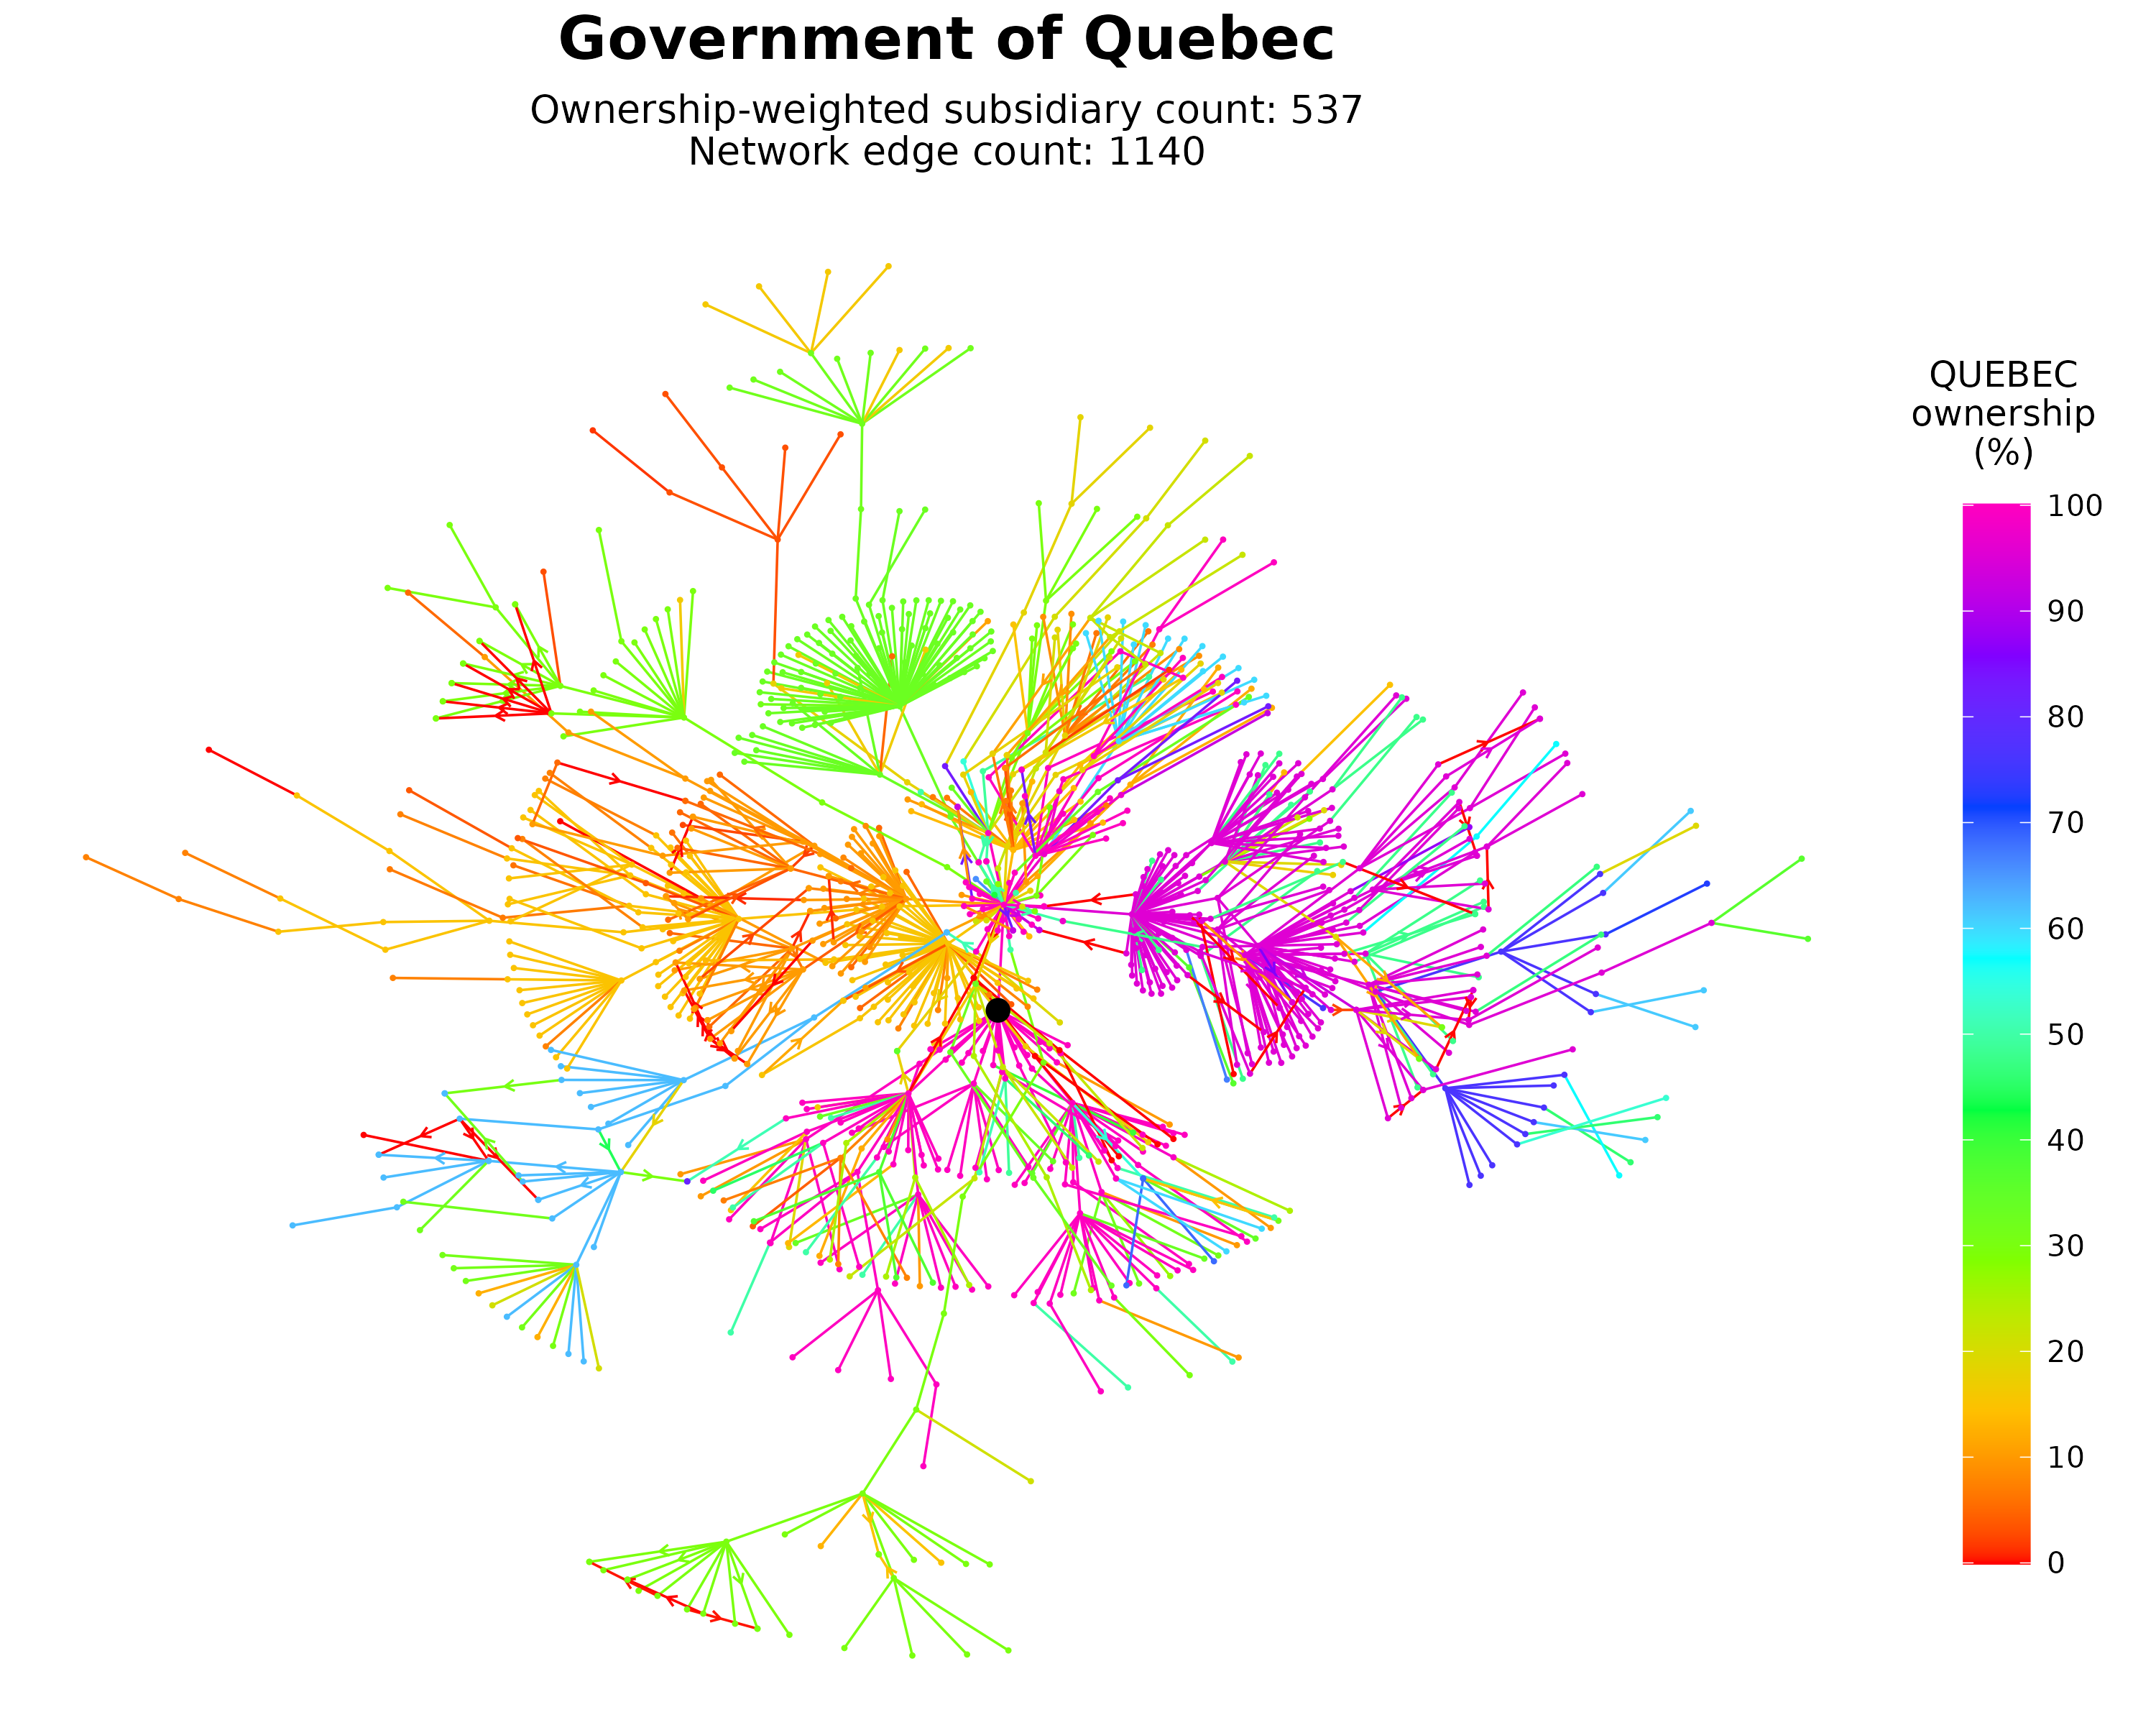
3. Government of Quebec. Interactive chart
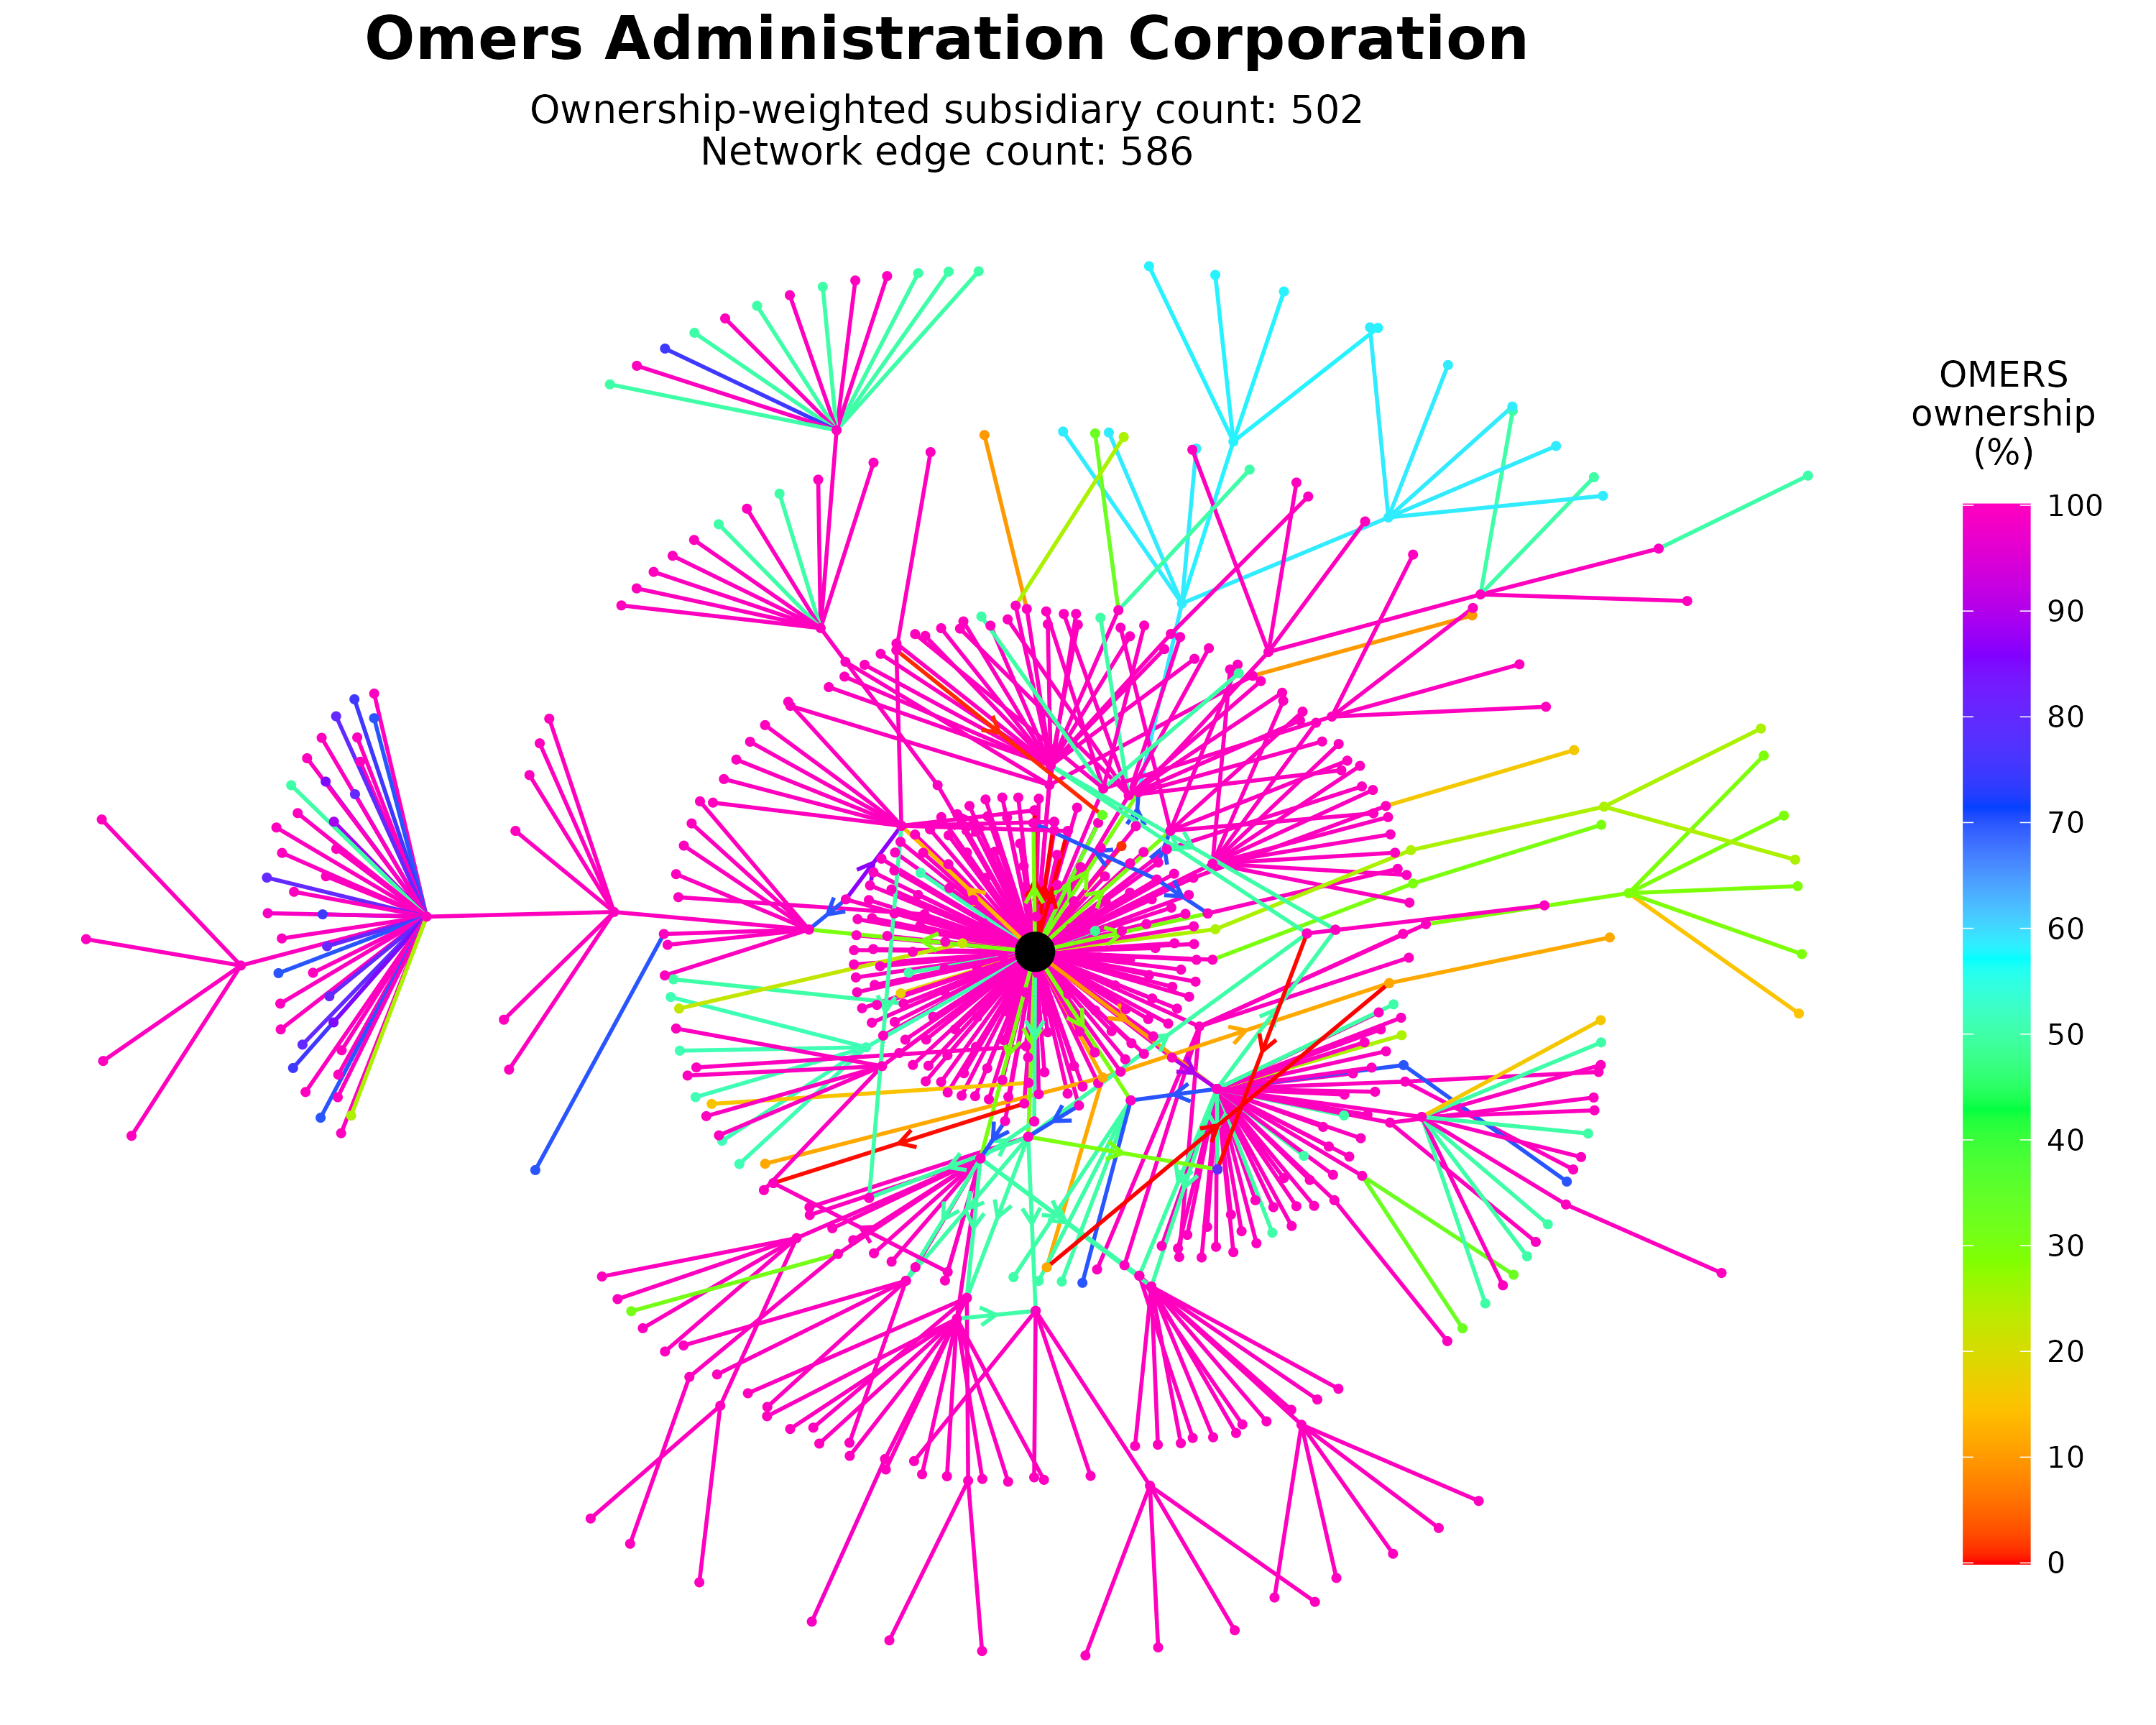
4. Omers Administration Corporation. Interactive chart
5. Government of Canada. Interactive chart
6. TMX Group. Interactive chart
7. Winchester Investments. Interactive chart
8. M Cooper Group. Interactive chart
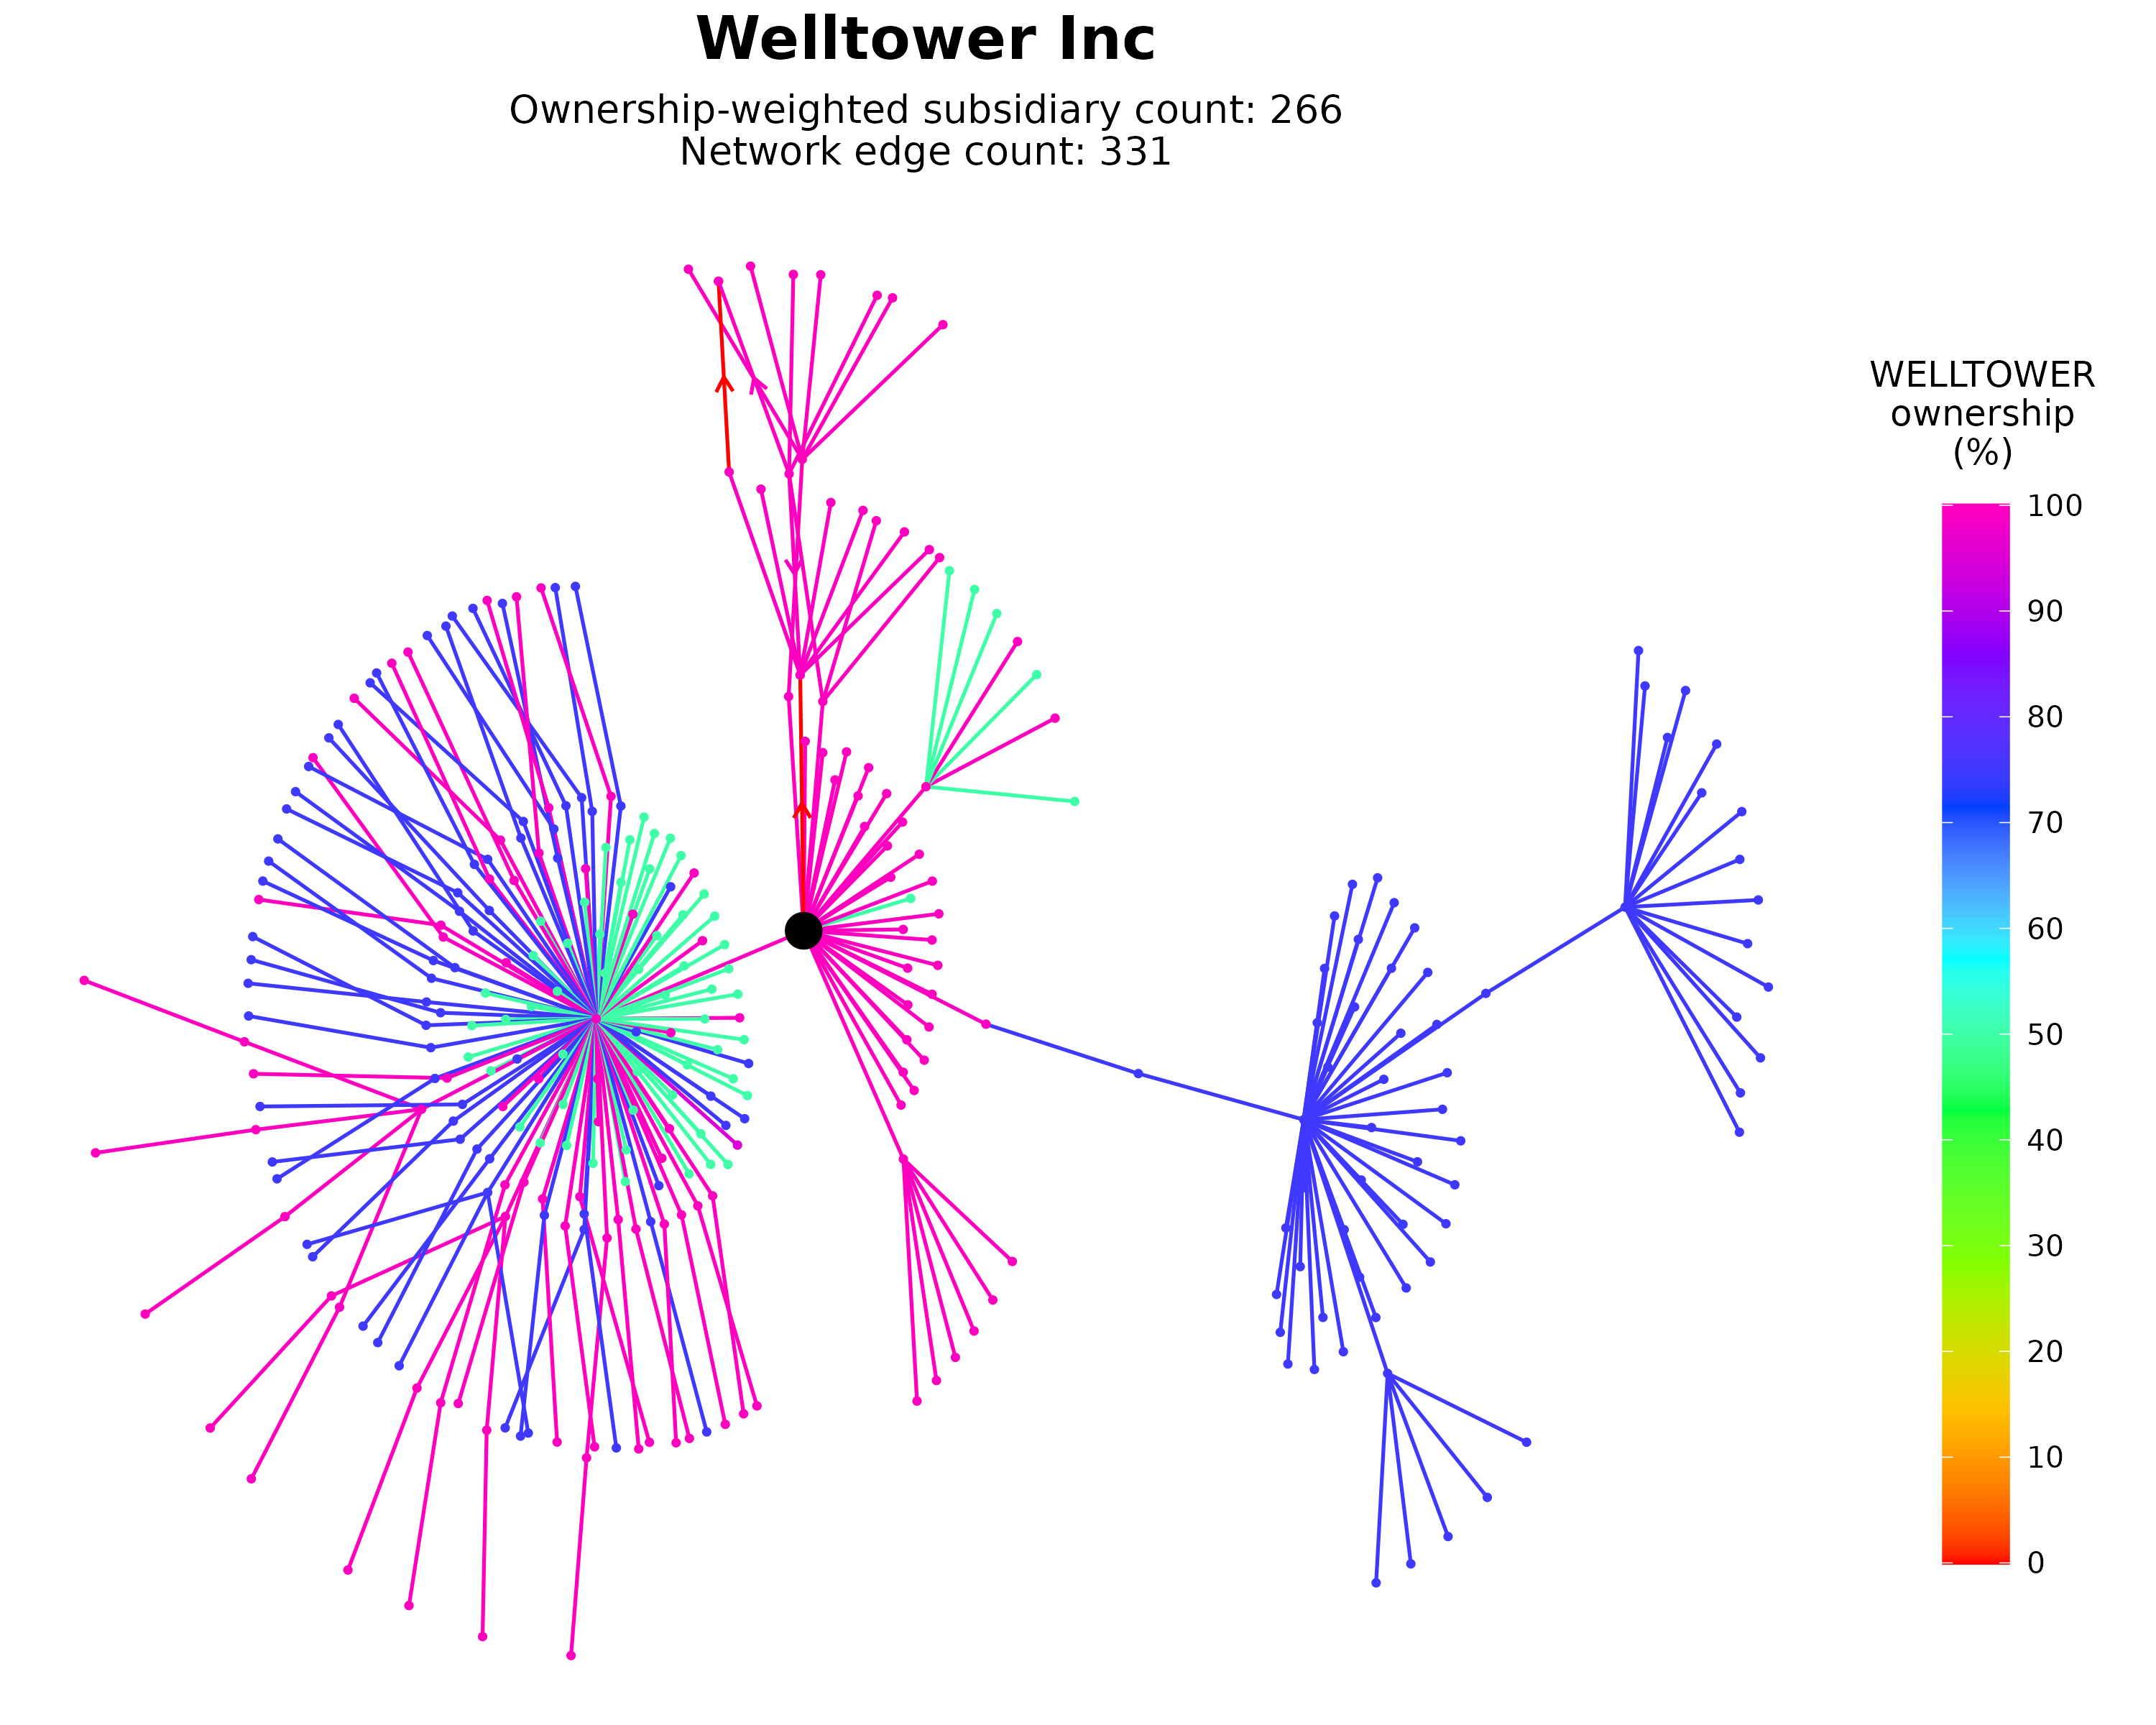
9. Welltower Inc. Interactive chart
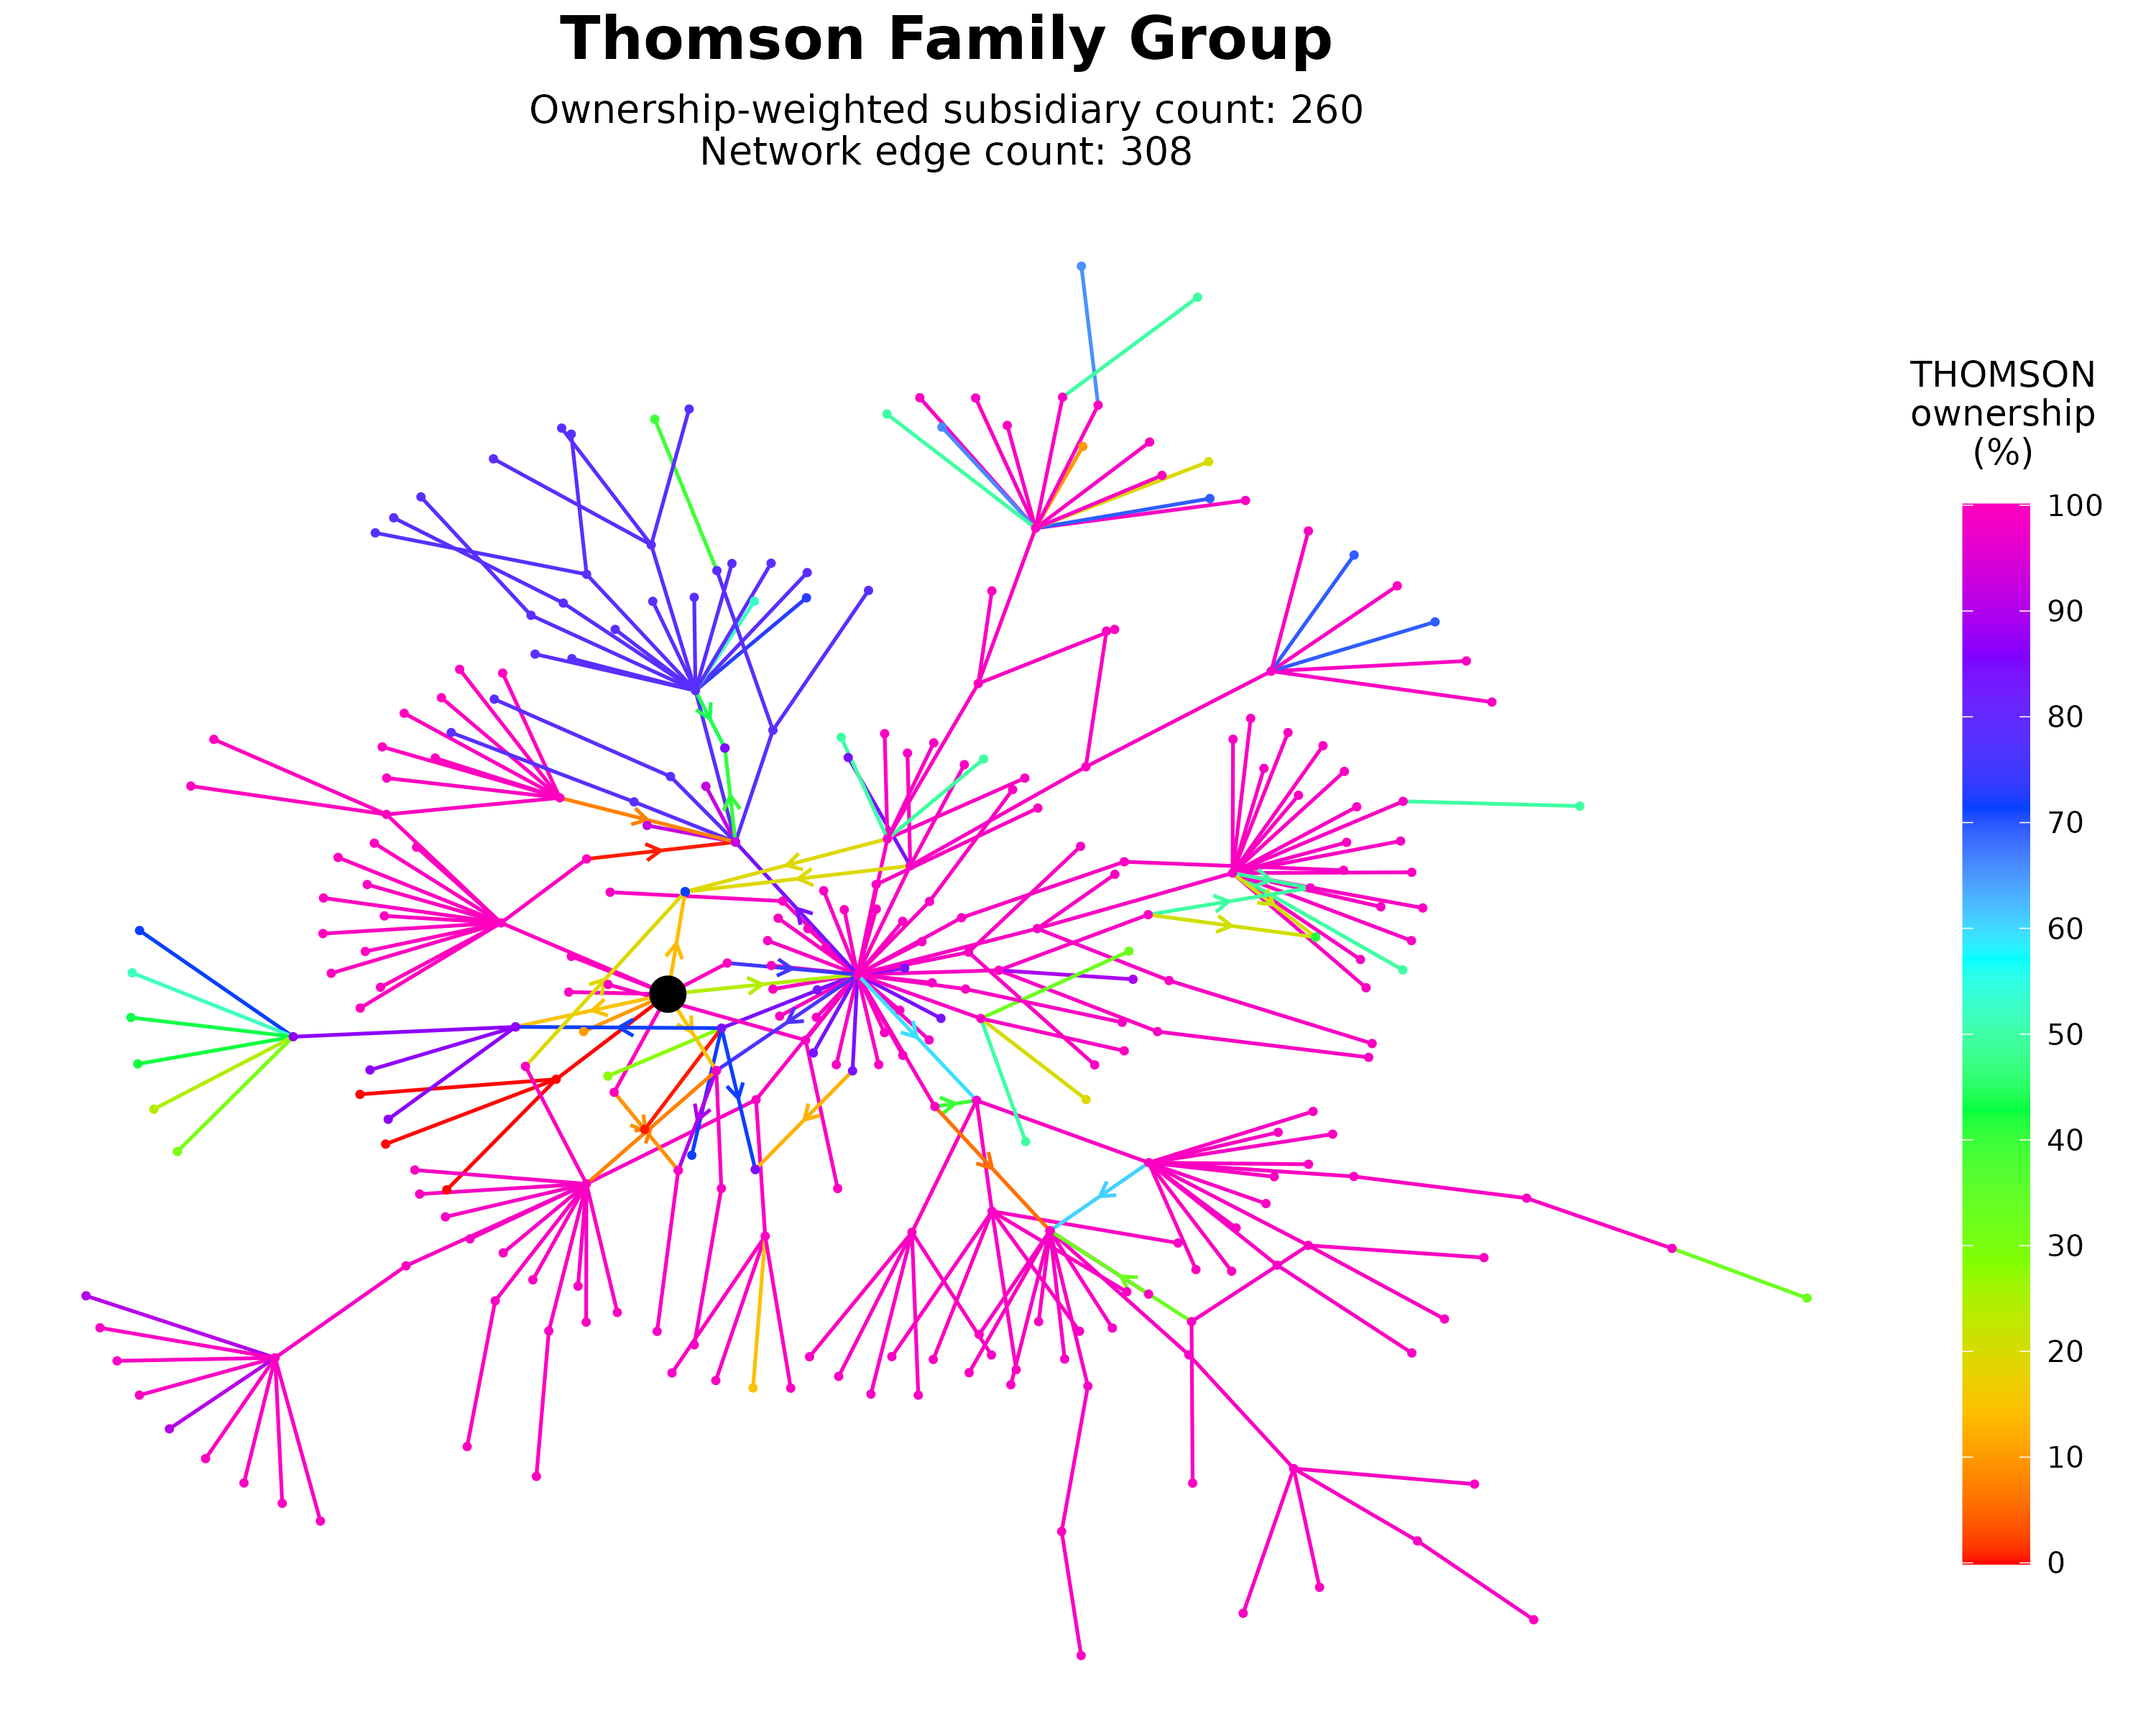
10. Thomson Family Group. Interactive chart
Until next time
Well, that’s it for this update. As always, thanks for your support. And if you have the time, please give these interactive charts a go and tell me what you think.
Best,
Blair